No. 76-77 – March 31, 2006 |
Other articles on similar
subjects
are published in English
in the
Offline
column
|

|
Growth
and difference |
|
|
This issue of NetMarketing combines two (76 and 77) of the
Italian edition. It summarizes the situation of data on internet development
at year end 2005 – and, as in the cases of several previous issues,
it will remain here as a “historical” reference when the files
in the data section are updated.
Of course there is no exact “certainty” in any statistics.
But this series of analyses, that has been going on for ten years,
can help to trace some relevant trends over time.
The evolution is complex, but some things are clear. One is
that the internet continues to grow with considerable speed.
In year 2005 hostcount figures increased 24 percent worldwide
– and even faster (33 percent) in Europe.
Another fact is that we are still far behind any conceivable
“saturation threshhold”. There is remarkably
fast growth also in those countries that already have the
highest levels of internet activity.
However, the situation remains seriously unbalanced. Some
areas that were traditionally “weak” show substantial
improvement. A “big” example is India – the
fastest growing country in the internet worldwide in 2004-2005,
though still far below its potential. But a large part of the world
remains very weakly connected, if not totally isolated.
In this issue, as in March 2005,
in addition to a summary of international
and European developments, we see
aso some data on the situation of the internet in Latin
America, Asia and Africa.
back to top
|

|
2. New
international data |
|
|
Nearly 400 million internet hosts were found active
worldwide at the end of 2005. (The total exceeded 100
million in year 2000, 200 in 2003 and 300 in 2004).
This is the growth from 1994 to 2005 (there are more
details in international data.)
| |
Number
of hosts |
annual
growth |
| 1994 |
5,800,000 |
+ 119 % |
| 1995 |
12,900,000 |
+ 104 % |
| 1996 |
21,800,000 |
+ 52 % |
| 1997 |
29,700,000 |
+ 36 % |
| 1998 |
42,200,000 |
+ 46 % |
| 1999 |
72,400,000 |
+ 68 % |
| 2000 |
109,600,000 |
+ 51 % |
| 2001 |
147,300,000 |
+ 35 % |
| 2002 |
171,600,000 |
+ 17 % |
| 2003 |
233,100,000 |
+ 36 % |
| 2004 |
317,646,000 |
+ 36 % |
| 2005 |
394,992,000 |
+ 24 % |
There have been variations in speed, but the growth
of the internet continues to be very fast. This chart shows
the broad picture by “large geographic areas”.
Large
geographic areas
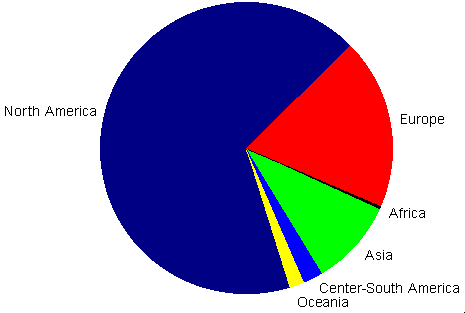
The general picture hasn’t changed, compared to past
years. The internet isn’t “global”. A large part
of the world has scarce access. North America and Europe, with
19 percent of the population, have 87 percent of the worldwide
activity on the internet.
The continent (outside North America) with the highest density
is Oceania-Pacific, that has over 200 internet hosts per 1000
inhabitants. The average in Europe is over 100. In Latin America
it is 20 (in spite of growth, still below the world average). In Asia
9.4 and in Africa 1 per thousand.
In 1999 there were six countries worldwide with over a million
internet hosts (two in Europe). In 2000 they were ten (four in Europe).
In 2001 thirteen (six in Europe). Seventeen (nine in Europe) in 2002
and twenty in 2003. Now there are twentysix – sixteen in
Europe, five in the Americas, four in Asia and one in Oceania.
The countries with over three million internet hosts were two
in 2001, eight in 2003 and thirteen in 2005. Ten countries (five
in Europe) now have over five million.
This table updates the data for the 34 countries (of 240)
with over 500,000 internet hosts.
| |
Number of hosts
December 2005 |
% growth
in a year |
% of
total |
Per 1000
inhab. |
| United States |
233,000,000 |
+ 21.9 |
59.0 |
793.5 |
| Japan |
24,903,759 |
+ 27.4 |
6.3 |
195.1 |
| Germany |
9,852,798 |
+ 60.8 |
2.5 |
119.4 |
| United Kingdom * |
9,800,000 |
n,a, |
2.5 |
164.3 |
| Italy * |
9,600,000 |
+ 20.1 |
2.4 |
164.2 |
| Netherlands |
7,258,159 |
+ 12.6 |
1.8 |
446.4 |
| France |
6,863,156 |
+ 37.2 |
1.7 |
113.8 |
| Australia |
6,039,486 |
+ 25.3 |
1.5 |
299.3 |
| Canada * |
6,000,000 |
n,a, |
1.5 |
187.8 |
| Brazil |
5,094,730 |
+ 29.2 |
1.3 |
28.8 |
| Spain * |
4,800,000 |
n.a. |
1.2 |
112.3 |
| Taiwan |
3,943,555 |
+ 12.2 |
1.0 |
173.8 |
| Poland |
3,941,769 |
+ 58.8 |
1.0 |
103.2 |
| Sweden |
3,100,000 |
+ 5.6 |
0.8 |
344.8 |
| Mexico |
2,555,047 |
+ 36.7 |
0.6 |
26.2 |
| Belgium |
2,546,148 |
+ 26.5 |
0.6 |
244.4 |
| Finland |
2,505,805 |
+ 30.8 |
0.6 |
478.5 |
| Denmark |
2,316,370 |
+ 21.4 |
0.6 |
429.2 |
| Switzerland |
2,125,269 |
+ 19.0 |
0.5 |
297.3 |
| Norway |
2,109,283 |
+ 54.1 |
0.5 |
457.9 |
| Austria |
1,957,154 |
+ 22.8 |
0.5 |
241.5 |
| Russia |
1,656,352 |
+ 43.1 |
0.4 |
11.4 |
| South Korea * |
1,500,000 |
n.a. |
0.4 |
32.6 |
| Argentina |
1,464,719 |
+ 39.4 |
0.4 |
40.4 |
| Portugal |
1,378,817 |
+ 127.7 |
0.3 |
131.6 |
| Israel |
1,212,264 |
+ 20.7 |
0.3 |
176.6 |
| Czech Rep. |
993,778 |
+ 37.1 |
0.3 |
97.3 |
| New Zealand |
971,900 |
+ 49.1 |
0.2 |
242.4 |
| Hungary |
894,800 |
+ 46.2 |
0.2 |
88.4 |
| Hong Kong |
859,926 |
= |
0.2 |
124.9 |
| India |
838,139 |
+ 203.5 |
0.2 |
0.81 |
| Singapore |
804,262 |
+ 31.7 |
0.2 |
230.7 |
| Turkey |
794,795 |
+ 30.0 |
0.2 |
11.7 |
| Thailand |
787,342 |
+ 53.1 |
0.2 |
12.2 |
| Ireland * |
550,000 |
n.a. |
0.1 |
136.0 |
| Greece |
503,687 |
+ 34.3 |
0.1 |
45.6 |
| Total |
394,991,609 |
+ 24.3 |
|
27.3 |
Figures
for the United States are “weighted” approximately to
account for the fact
that some of the “apparently
American” domains are in other countries.
Worldwide
density is based on hostcount and population exluding the US. |
* Figures for
the UK, Canada, Spain, South Korea and Ireland
are “arbitrarily
but not unreasonably” adjusted
to compensate for
underestimated hostcount data in this period.
* The
figure for Italy, that appears overestimated
in the hostcount
survey in recent years, is reduced by 15 percent.
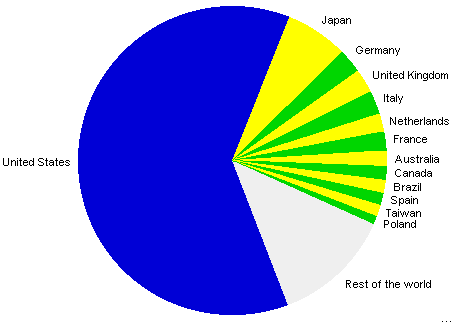
The percentage of US hoscount on the worldwide total
has been gradually decreasing, but it is still dominant, as
we see in this graph (countries with over three million
internet hosts.)
Internet
hosts in 13 countries
countries worldwide with over three
million hosts
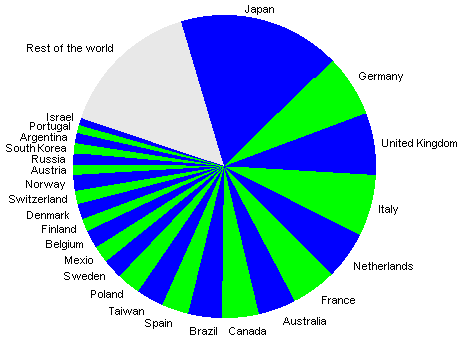
If we exclude the United States, this is the picture for
the other 25 countries with over a million internet hosts.
Internet
hosts in 25 countries
countries worldwide with over a million
hosts (Unites States excluded)
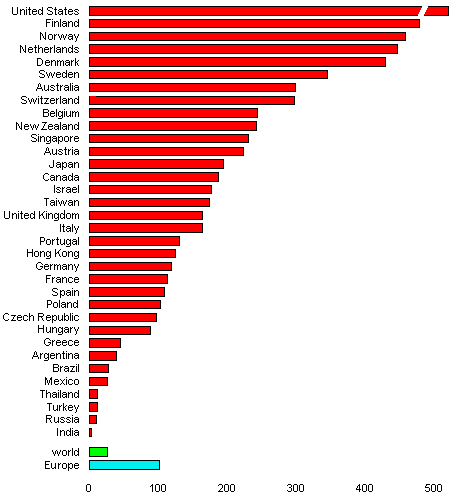
This is an update of the graph for density (hosts per 1000 inhabitants)
in the 34 countries worldwide with over 500,000 internet hosts.
Internet
hosts per 1000 inhabitants in 34 countries
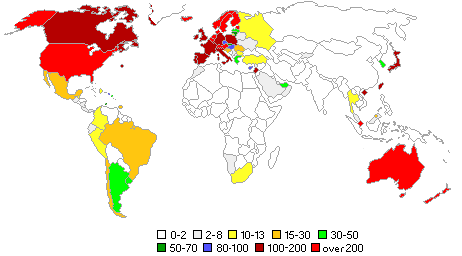
And here is a picture of internet density as a world map.
Internet hosts per 1000
inhabitants
More detailed analyses and comments, including
a graph of hostcount in relation to income, are in the
international data report.
back to top
|

|
3. New European data |
|
|
Total European houscount exceeded 30 million in 2003,
50 in 2004 and 70 nel 2005. At this time growth in Europe
(+ 33 percent in a year) appears to be faster than the
world average (+ 24 percent).
There are some further changes in the internet in Europe
compared to a year ago (issue
74.) As usual, a more detailed report is in
European data.
This is an update of the situation in the 31 European
countries with over 50,000 internet hosts.
| |
Number of hosts
December 2005 |
% of
Europe |
Per 1000
inhab. |
| Germany |
9,852,798 |
13.7 |
119.4 |
| United Kingdom * |
9,800,000 |
13.6 |
164.3 |
| Italy * |
9,600,000 |
13.4 |
164.2 |
| Netherlands |
7,258,159 |
10.1 |
446.4 |
| France |
6,863,156 |
9.5 |
113.8 |
| Spain * |
4,800,000 |
6.7 |
112.3 |
| Poland |
3,941,769 |
5.5 |
103.2 |
| Sweden |
3,100,000 |
4.3 |
344.8 |
| Belgium |
2,546,148 |
3.5 |
244.4 |
| Finland |
2,505,805 |
3.5 |
478.5 |
| Denmark |
2,316,370 |
3.2 |
429.2 |
| Switzerland |
2,125,269 |
3.0 |
297.3 |
| Norway |
2,109,283 |
2.9 |
457.9 |
| Austria |
1,957,154 |
2.7 |
241.5 |
| Russia |
1,656,352 |
2.3 |
11.4 |
| Portugal |
1,378,817 |
1,9 |
131.6 |
| Czech Republic |
993,778 |
1.4 |
97.3 |
| Hungary |
894,800 |
1.2 |
88.4 |
| Ireland * |
550,000 |
0.8 |
136.0 |
| Greece |
503,687 |
0.7 |
45.6 |
| Romania |
446,686 |
0.6 |
20.5 |
| Estonia |
355,085 |
0.5 |
262.8 |
| Slovakia |
322.753 |
0.4 |
60.0 |
| Lithuania |
206,581 |
0.3 |
60.3 |
| Ukraine |
192,476 |
0.3 |
4.0 |
| Iceland |
191,528 |
0.3 |
652.4 |
| Bulgaria |
161,405 |
0.2 |
20.7 |
| Croatia |
132,130 |
0.18 |
29.6 |
| Latvia |
90,536 |
0.13 |
39.2 |
| Luxembourg |
84,257 |
0.12 |
185.2 |
| Slovenia |
61,408 |
0.09 |
30.8 |
| European Union |
64,578,811 |
89.8 |
144.6 |
| Europe |
71.888.284 |
|
101,9 |
* Figures for
the UK, Spain and Ireland are “arbitrarily
but not unreasonably” adjusted
to compensate for
underestimated hostcount data in this period.
*
The figure for Italy, that
appears overestimated
in the hostcount survey in
recent years, here is reduced by 15 percent.
Growth in France and Portugal is faster than in past
years. Strong development continues in Poland and in
other eastern European countries.
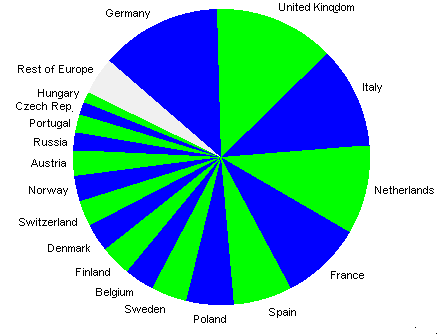
This “pie” graph shows the situation, at the
end of 2005, for the 18 European countries with over 500,000
internet hosts (that have 95 % of the total hostcount in Europe.)
Internet
hosts in 18 Euroopean countries
countries with over 500,000
hosts
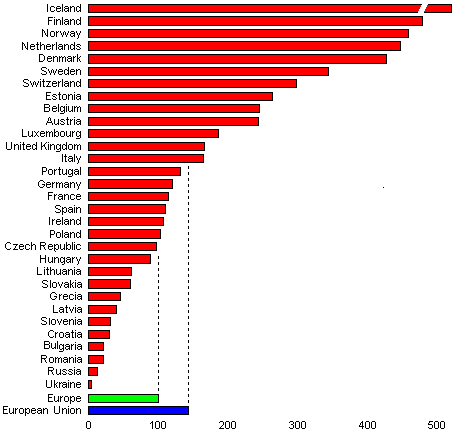
This is an update of density (hosts per 1000 inhabitants)
for the 31 European countries with over 50,000 internet hosts.
Internet hosts
per 1000 inhabitants
in 31 European countries
And this is the picture as a map.
Internet hosts per
1000 inhabitants 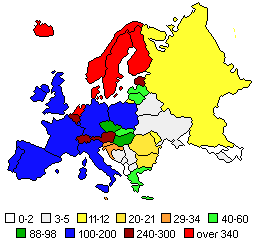
The internet is growing almost everywhere in Europe, but the highest
density remains in the Scandivavian area and in the Netherlands.
back to top
|

|
4. Latin
America, Asia and Africa |
|
|
An analysis of large
language communities in the data section includes
information on the development of the internet in Latin
America – that in 2005, for the first time,
exceeded 10 million internet hosts.
In this chart we see the situation in the 16 countries
with over 5,000 hosts (that have over 99 percent of the
total hostcount in Latin America.)
| |
Number of hosts
December 2005 |
Per 1000
inhab. |
| Brazil |
5,094,730 |
28.1 |
| Mexico |
2,555,047 |
24.5 |
| Argentina |
1,464,719 |
39.2 |
| Chile |
462,420 |
29.9 |
| Colombia |
440,585 |
9.7 |
| Peru |
263,786 |
9.6 |
| Uruguay |
125,775 |
38.8 |
| Dominican Rep. |
98,180 |
11.1 |
| Venezuela |
47,614 |
1.9 |
| Guatemala |
44,635 |
3.8 |
| Nicaragua |
18,638 |
3.4 |
| Ecuador |
17,701 |
1.4 |
| Bolivia |
16,274 |
1.9 |
| Costa Rica |
12,596 |
3.0 |
| Paraguay |
10,840 |
2.0 |
| Panama |
9,626 |
3.1 |
| Latin America |
10,695,000 |
20.1 |
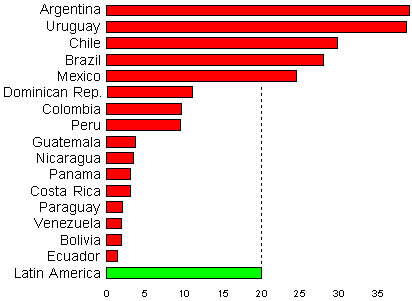
This graph shows density (internet hosts per thousand inhabitants).
Internet hosts per 1000
inhabitants
in 16 Latin American countries
And this is the picture as a map.
Internet hosts per 1000
inhabitants
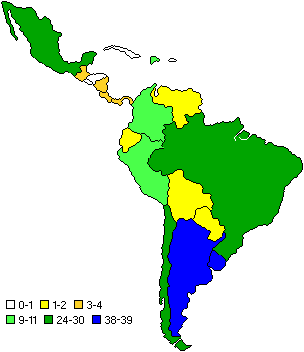
The same five countries as in past years (Argentina, Uruguay,
Chile, Brazil and Mexico) remain ahead of general density in the
area (the first four are above the world average). But also in other
parts of Latin America there is relevant growth.
This is a summary of a document in the data section
that covers the situation in Asia.
The chart includes the 20 countries with over 10,000 internet
hosts (that have 99 percent of the total hostcount in Asia.)
| |
Number of hosts
December 2005 |
% of
Asia |
Per 1000
inhab. |
| Japan |
24,903,759 |
70.3 |
195.4 |
| Taiwan |
3,943,555 |
11.1 |
173.8 |
| South Korea |
1,500,000 |
4.2 |
32.6 |
| Israel |
1,212,264 |
3.4 |
176.6 |
| Hong Kong |
859,926 |
2.4 |
124.9 |
| India |
838,139 |
2.4 |
0.81 |
| Singapore |
804,262 |
2.3 |
230.6 |
| Turkey |
794,795 |
2.2 |
11.7 |
| Thailand |
787,342 |
2.2 |
12.3 |
| China |
208,277 |
0.59 |
0.16 |
| Malaysia |
154,888 |
0.44 |
6.7 |
| Indonesia |
154,735 |
0.43 |
0.71 |
| Arab Emirates |
130,479 |
0.37 |
32.3 |
| Philippines |
107,336 |
0.30 |
1.40 |
| Saudi Arabia |
62,120 |
0.18 |
2.98 |
| Pakistan |
59,739 |
0.17 |
0.45 |
| Cyprus |
56,760 |
0.16 |
82.3 |
| Kazakhstan |
19,275 |
0.05 |
1.30 |
| Lebanon |
14,577 |
0.04 |
4.7 |
| Kirghizhstan |
13,973 |
0.04 |
2.7 |
| Jordan |
9,537 |
0.02 |
1.74 |
| Nepal |
8,853 |
0.02 |
0.38 |
| Viet Nam |
8,265 |
0.02 |
0.10 |
| Uzbekhstan |
7,923 |
0.02 |
0.30 |
| Brunei |
7,237 |
0.02 |
21.2 |
| Sri Lanka |
7,010 |
0.02 |
0.36 |
| Bhutan |
6,779 |
0.02 |
5.8 |
| Asia |
35,445,000 |
|
9.4 |
For the first time in 2004, with a fast increase of
hosctcunt, India had overtaken China. The trend
continued in 2005. India will probably exceed a
million internet hosts in 2006 – still far below
its potential, but a substantial increase compared to
the past (see the analysis of large
low-density countries.)
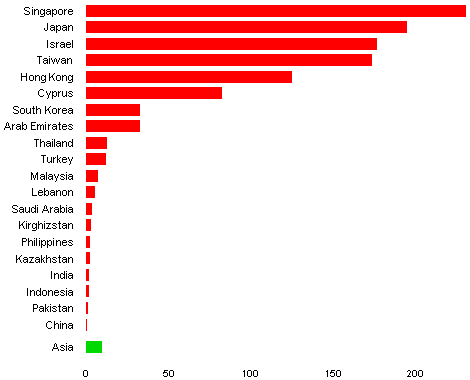
There are great differences in Asia, as shown by this
graph (internet hosts per 1000 inhabitants) in the 20
countries with over 10,000 internet hosts.
Internet hosts per 1000
inhabitants
in 20 countries in Asia
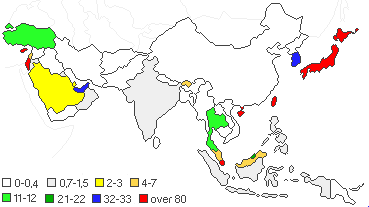
This is the picture as shown in a map of the central and
southern part of the continent – from the Middle East
to East Asia.
Internet hosts per 1000
inhabitants
Some data on the Chinese area are included in the analysis of
language communities.
Another document in the data section is an analysis
of the internet in Africa.
Here is a summary of the situation at year-end 2005. The
table includes the 19 African countries with over a thusand
internet hosts (that have 99 percent of the total in the
continent.)
| |
Number of hosts
December 2005 |
% of
Africa |
Per 1000
inhab- |
| South Africa |
468,888 |
55.8 |
10.6 |
| Morocco |
250,174 |
27.8 |
8.5 |
| Egypt |
86,548 |
9.6 |
1.26 |
| Kenya |
11,695 |
1.3 |
0.41 |
| Tanzania |
9,444 |
1.05 |
0.27 |
| Zimbabwe |
8,055 |
0.95 |
0.69 |
Mozambique |
7,676 |
0.85 |
0.40 |
| Mauritius |
4,958 |
0.55 |
4.1 |
| Namibia |
4,632 |
0.51 |
2.5 |
| Zambia |
2,789 |
0.31 |
0.27 |
| Swaziland |
2,642 |
0.29 |
2.7 |
| Angola |
2,516 |
0.28 |
0.21 |
| Nigeria |
2,498 |
0.27 |
0.03 |
| Ivory Coast |
2,224 |
0.25 |
0.14 |
| Botswana |
2,097 |
0.23 |
1.25 |
| Ghana |
1,783 |
0.20 |
0.09 |
| Rwanda |
1,744 |
0.19 |
0.21 |
| Congo |
1,516 |
0.17 |
0.04 |
| Uganda |
1,362 |
0.15 |
0.06 |
| Africa |
900,000 |
|
1.06 |
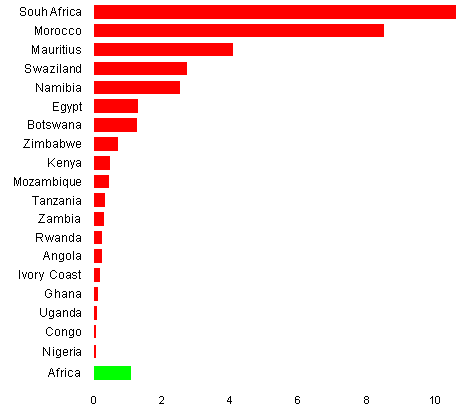
This is density as a graph.
Internet hosts per 1000
inhabitants
in 19 African countries
Two other
small insular countries,
the Seychelles e São Tomé
& Principe,
have higher density than Mauritius.
Density in most of Africa is comparable to, or below, the level
of Nigeria. In a general picture of very weak internet activity, there
are large differences also in Africa. Recent changes include the
growth of Morocco. Egypt, that appeared slower in recent years,
now seems to be growing again – but still remains far
behind “European” levels.
This is the density picture as a map.
Internet hosts per 1000
inhabitants
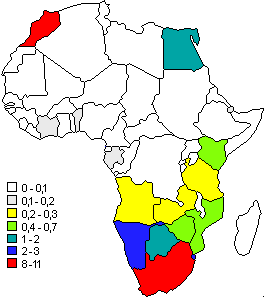
In 2005 Africa had faster growth (+ 35 percent) than the
world average (+ 24 percent). And in some African countries
the speed was considerably higher. But the fact remains that
the whole continent, with 14 percent of the world’s
population, has 0.3 percent of global activity in the internet.
The picture is evolving everywhere. There are different
speeds of growth, and different levels of density, inside all
of the areas, from those with the highest concentration, such
as North America and Europe, to the weakest environments,
such as Africa and most of Asia. There is still large room for
development in all parts of the world.
|
|