Other articles on similar
subjects
are published in English
in the
Offline
column
|
 |
1.
Growth continues |
|
|
As usual, more detailed analyses are in the
data section. This issue contains
a summary, which will remain as a point of comparison when
the general reports are updated – probably six months from now.
Recently published figures (up to December 2004) confirm fast
growth of the internet.
There are now over 300 million internet hosts worldwide,
with 36 percent growth compared to a year earlier. There are still
very large differences between the most developed coutries and
those with limited internet activity, but there is strong growth in
several parte of the world.
Recent growth in Europe is faster than the world average,
with a total of over 50 million internet hosts. As in
issue 73, this summary includes an
update of internet development in Latin America, Asia and Africa.
back to top
|
 |
2. New worldwide data |
|
|
The analysis of international data
confirms strong growth of the internet worldwide. This is the evolution
from 1994 to 2004.
| |
Number
of hosts |
annual
growth |
| 1994 |
5,800,000 |
+ 119 % |
| 1995 |
12,900,000 |
+ 104 % |
| 1996 |
21,800,000 |
+ 104 % |
| 1997 |
28,700,000 |
+ 52 % |
| 1998 |
42,200,000 |
+ 46 % |
| 1999 |
72,400,000 |
+ 68 % |
| 2000 |
109,600,000 |
+ 51 % |
| 2001 |
147,300,000 |
+ 35 % |
| 2002 |
171,600,000 |
+ 17 % |
| 2003 |
233,100,000 |
+ 36 % |
| 2004 |
317,646,000 |
+ 36 % |
Updated information confirms an acceleration in 2003 and 2004
after a (relatively) slower phase in 2001-2002.
The broad picture by “large geographic areas”
hasn’t basically changed.
Large
geographic areas
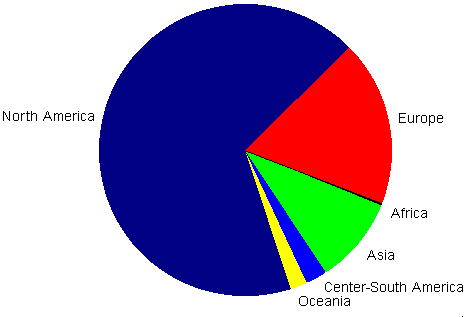
In the last two or three years growth in central-south America, Asia
and Europe was faster than the world average. The percentage of North
America is constantly (though slowly) decreasing, but it still has a dominant
share, mostly because of internet concentration in the United States.
In 1999 there were six countries worldwide with over a million
internet hosts (two in Europe). In 2000 there were ten (four in Europe).
In 2001 thirteen (six in Europe). Seventeen (nine in Europe) in 2002
and twenty in 2003. Now there are twentyfour – fifteen in Europe,
five in the Americas, three in Asia and one in Oceania.
The countries with over three million hosts were two in 2001, eight
in 2003 and there are eleven in 2004. Seven countries (five in Europe)
now have over four million.
Some data are questionable – as in the case of Italy (traditionally
much weaker) now appearing far ahead of the UK and Germany. But the
broad picture is fairly coherent and consistent over time.
This chart shows data for 33 countries (of 240) with over 500,000
internet hosts.
| |
Number of hosts
December 2004 |
% growth
in a year |
% of
total |
Per 1000
inhabit. |
| United States |
191,000,000 |
+ 29.9 |
62.0 |
679.1 |
| Japan |
19,543,040 |
+ 50.1 |
6.2 |
153.1 |
| Italy |
9,343,663 |
+ 70.1 |
2.9 |
161.4 |
| Netherlands |
6,443,558 |
+ 88.5 |
2.0 |
397.2 |
| Germany |
6,127,262 |
+ 79.1 |
1.9 |
74.2 |
| United Kingdom |
6,000,000 |
n,a, |
1.9 |
100.9 |
| France |
4,999,770 |
+ 80.4 |
1.6 |
83.7 |
| Australia |
4,820,646 |
+ 69.3 |
1.5 |
242.5 |
| Brazil |
3,934,577 |
+ 24.4 |
1.2 |
22.2 |
| Canada |
3,839,173 |
+ 19.6 |
1.2 |
121.4 |
| Taiwan |
3,516,215 |
+ 26.6 |
1.1 |
155.9 |
| Spain |
2,800,000 |
n,a, |
0.9 |
66.9 |
| Sweden |
2,668,816 |
+ 73.3 |
0.8 |
298.0 |
| Poland |
2,482,546 |
+ 91.4 |
0.8 |
65.0 |
| Belgium |
2,012,283 |
+ 38.4 |
0.6 |
194.0 |
| Finland |
1,915,506 |
+ 52.1 |
0.6 |
367.0 |
| Denmark |
1,908,737 |
+ 30.1 |
0.6 |
354.6 |
| Mexico |
1,868,583 |
+ 40.1 |
0.6 |
18.2 |
| Switzerland |
1,785,472 |
+ 75.3 |
0.6 |
244.0 |
| Austria |
1,594,059 |
+ 62.3 |
0.5 |
197.4 |
| Norway |
1,367,973 |
+ 35.0 |
0.4 |
298.8 |
| Russia |
1,157,677 |
+ 44.7 |
0.4 |
8.0 |
| Argentina |
1,050,639 |
+ 41.5 |
0.3 |
28.4 |
| Israel |
1,004,141 |
+ 58.4 |
0.3 |
148.8 |
| Hong Kong |
856,244 |
+ 44.6 |
0.3 |
127.6 |
| South Korea |
800,000 |
n,a, |
0.3 |
16.7 |
| Czech Republic |
724,631 |
+ 100.1 |
0.2 |
71.0 |
| New Zealand |
651,065 |
+ 37.2 |
0.2 |
162.4 |
| Hungary |
611,887 |
+ 67.5 |
0.2 |
60.5 |
| Turkey |
611,557 |
+ 70.1 |
0.2 |
8.6 |
| Singapore |
610,655 |
+ 26.0 |
0.2 |
177.5 |
| Portugal |
605,648 |
+ 101.9 |
0.2 |
58.0 |
| Thailand |
514,228 |
+ 395.9 |
0.2 |
8.0 |
| Total |
317,646,084 |
+ 36.3 |
|
21.4 |
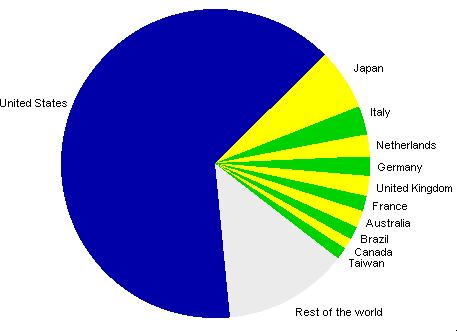
This graph shows the situation, at the end of 2004, for
the eleven countries with over three million internet hosts.
Internet
hosts in 11 countries
countries worldwide with
over three million hosts
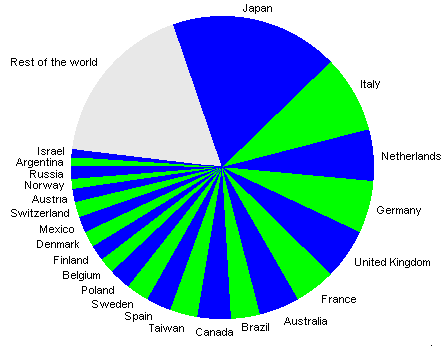
If, for better readability of the chart, we exclude the United States, this
is the picture for the other 23 countries with over a million hosts.
Internet hosts in
23 countries
countries
worldiwide with over a million hosts (US
excluded)
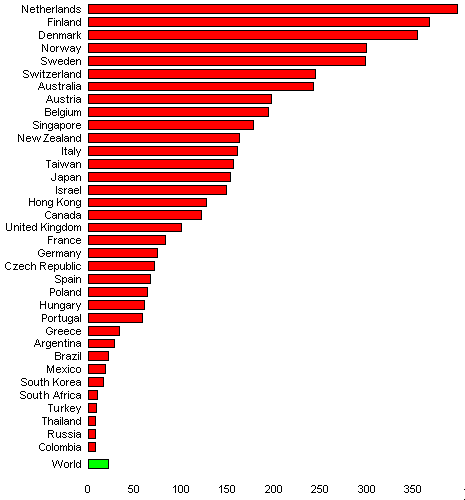
This is an update of the graph showing density (hosts per 1000 inhabitants)
for the 33 countries (excluding the US) with over 500,000 internet hosts.
Internet hosts
per 1000 inhabitants in 33 countries
And, as usual, this is the density picture shown as a map.
Internet hosts
per 1000 inhabitants
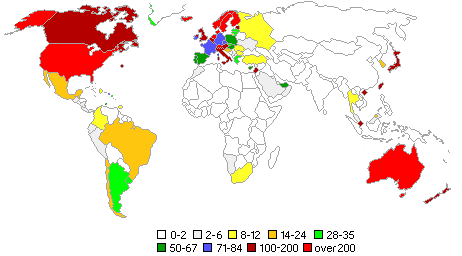
The two largest countries in the world still have low internet activity, but
there seems to be an acceleration in India – as we shall see in the summary
of the situation in Asia.
More detailed data and comments, including a graph of hostcount in relation
to income, are in the international data analysis.
back to top
|
 |
3.
New European data |
|
|
There are further relevant changes in Europe compared to the
situation that was summarized in
issue 73 (October 2004.) As
usual, a more detailed analsis, with comments, is in the basic docuument
on European data.
Now the total hostcount in Europe is close to 54 million. This is an
update for the 26 European countries with over 100,000 internet hosts.
| |
Number of hosts
December 2004 |
% of
Europe |
Per 1000
inhabit. |
| Italy |
9,343,663 |
17.3 |
161.4 |
| Netherlands |
6,443,558 |
11.9 |
397.2 |
| Germany |
6,127,262 |
11.4 |
74.2 |
| United Kingdom |
6,000,000 |
11.1 |
100.9 |
| France |
4,999,770 |
9.3 |
83.7 |
| Spain |
2,800,000 |
5.2 |
66.9 |
| Sweden |
2,668,816 |
5.0 |
298.0 |
| Poland |
2,482,546 |
4.6 |
65.0 |
| Belgium |
2,012,284 |
3.7 |
194.0 |
| Finland |
1,915,506 |
3.6 |
367.0 |
| Denmark |
1,908,737 |
3.5 |
354.6 |
| Switzerland |
1,785,472 |
3.3 |
244.0 |
| Austria |
1.594,059 |
3.0 |
197.4 |
| Norway |
1,367,973 |
2.5 |
298.8 |
| Russia |
1,157,677 |
2.1 |
8.0 |
| Czech Republic |
724,631 |
1.3 |
71.0 |
| Hungary |
611,887 |
1.1 |
60.5 |
Portugal |
605,648 |
1.1 |
58.0 |
| Greece |
377,221 |
0.70 |
34.2 |
| Ireland |
300,000 |
0.56 |
75.6 |
| Romania |
276,201 |
0.51 |
12.7 |
| Estonia |
237,461 |
0.44 |
175.1 |
| Slovakia |
188,352 |
0.35 |
35.0 |
| Ukraine |
151,366 |
0.28 |
3.2 |
| Iceland |
144,636 |
0.27 |
541.8 |
| Lithuania |
106,458 |
0.20 |
30.8 |
| European Union |
48,876,478 |
90.6 |
109.7 |
| Europe |
53,965,000 |
|
82.4 |
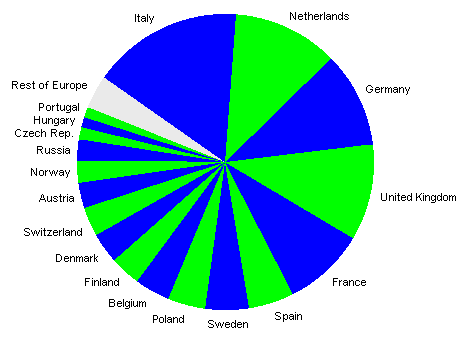
In addition to the continuing (and surprising) growth of Italy
and further development in the Netherlands, rencent changes include
an acceleration in France and a strong increase in Poland.
This graph shows the situation, in the first half of 2004, in the 18
European countries with over 500,000 internet hosts.
Internet
hosts in 18 European countries
countries with over 500,000
hosts
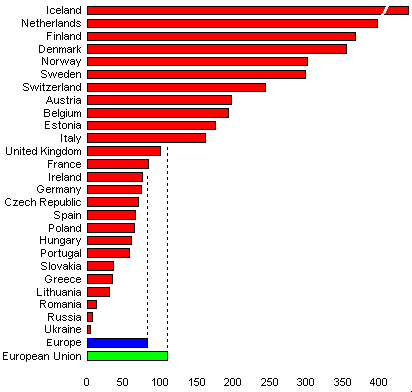
This is an update of the graph showing density (hosts per 1000
inhabitants) in the 26 European countries with over 100,000 internet hosts.
Internet hosts per 1000
ihabitants
in 26 European countries
And this is the density picture as a map of Europe.
Internet hosts per 1000
inhabitants
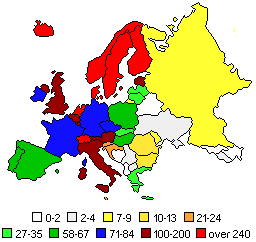
There is considerable growth almost everywhere in Europe, but there
are still great differences in an always changing and evolving situation.
back to top
|
 |
4.
Latin America, Asia and Africa |
|
|
In the data section there is an analysis of
large language communities
that includes a description of internet development in Latin America.
This table shows the situation in the 16 Latin American countries
with over 5,000 internet hosts.
| |
Number of hosts
December 2004 |
Per 1000
inhabit. |
| Brazil |
3,934,577 |
22.2 |
| Mexico |
1,868,583 |
18.2 |
| Argentina |
1,050,639 |
28.4 |
| Colombia |
324,889 |
7.3 |
| Chile |
294,575 |
19.6 |
Peru |
177,948 |
6.6 |
| Uruguay |
112,640 |
33.2 |
| Dominican Rep. |
81,773 |
9.4 |
| Venezuela |
45,345 |
1.8 |
| Guatemala |
23,786 |
2.1 |
| Ecuador |
14,045 |
1.1 |
| Costa Rica |
12,261 |
3.0 |
| Bolivia |
12,158 |
1.42 |
| Nicaragua |
11,353 |
2.1 |
| Paraguay |
9,720 |
1.8 |
| Panama |
9,626 |
2.9 |
| Latin America |
7,980,000 |
15.9 |
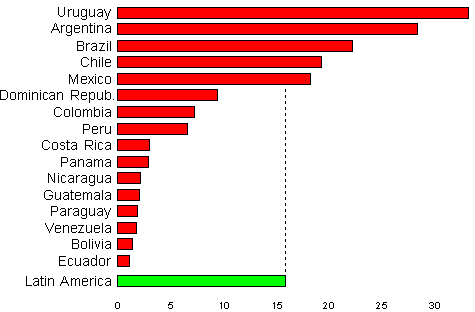
This graph shows density (internet hosts per thousand inhabitants.)
Internet
hosts per 1000 inhabitants
in 16 Latin American
countries
And this is density in Latin America seen as a map.
Internet hosts
per 1000
inhabitants
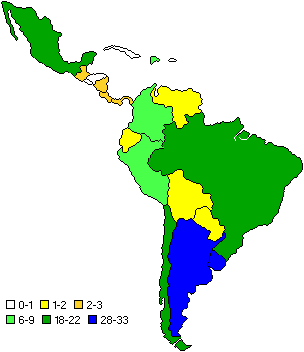
As was easily predictable, cionsidering the trend in reecent years,
Argentina is now the third Latin American country with over a million
internet hosts. Also Uruguay and Brazil are above the world density
average. There is relevant growth in several other countries. A more
detailed analysis (including a graph in relation to income) is in the report
on large language communities.
Here is a summary of a new report in the data section that covers the
situation in Asia. This table includes
the 19 countries (of 50 in Asia) with over 10,000 internet hosts.
| |
Number of hosts
December 2004 |
% of Asia |
Per 1000
inhabit. |
| Japan |
19,543,040 |
68.5 |
153.1 |
| Taiwan |
3,516,215 |
12.3 |
155.9 |
| Israel |
1,004,141 |
3.5 |
148.8 |
| Hong Kong |
856,244 |
3.0 |
127.6 |
| South Korea |
800,000 |
2.8 |
16.7 |
| Turkey |
611,557 |
2.1 |
8.6 |
| Singapore |
610,655 |
2.1 |
177.5 |
| Thailand |
514,228 |
1.8 |
8.0 |
| India |
276,293 |
0.97 |
0.26 |
| China |
163,626 |
0.57 |
0.13 |
| Malaysia |
139,932 |
0.49 |
5.6 |
| Indonesia |
130,600 |
0.46 |
0.6 |
| Arab Emirates |
117,573 |
0.41 |
29.5 |
| Philippines |
93,345 |
0.33 |
1.14 |
| Saudi Arabia |
52,091 |
0.18 |
2.18 |
| Cyprus |
39,366 |
0.14 |
55.0 |
| Pakistan |
32,038 |
0.11 |
0.22 |
| Kazakistan |
13,557 |
0.05 |
0.9 |
| Lebanon |
13,264 |
0.05 |
3.6 |
| Asia |
28,570,000 |
|
7.5 |
In 2004, for the first time, India’s hostcount has overtaken China.
But in both density, as related to population, remains very low. (As explained
in the analysis of large low-density contries.)
There are dramatic differences in Asia. As shown in this chart of density
(hosts per 1000 inhabitants) in the same 19 countries.
Internet hosts
per 1000 inhabitants
in 19 countries in
Asia
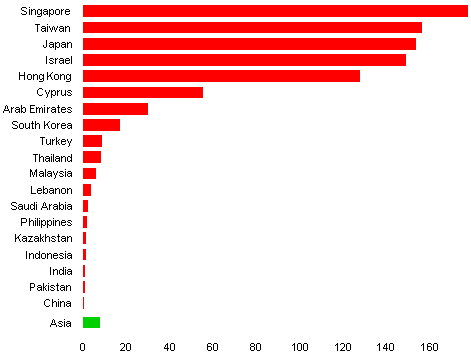
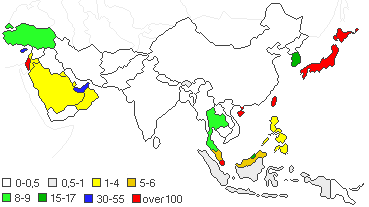
A few small contries, with less than 10,000 hosts, have higher
density of internet activity than most of Asia. The picture can be
summarized in a map that includes the central and southern part of the
continent, from the Middle East to East Asia.
Internet
hosts per 1000
inhabitants
In the report on large language
communities there is an analysis of the Chinese culture countries.
Another document in the data section covers the situation of the
internet in Africa, that was summarized
in issues 72 and 73,
and here is updated. This table includes the 14 African countries with
over 1,500 internet hosts.
| |
Number of hosts
December 2004 |
% of
Africa |
Per 1000
inhabit. |
| South Africa |
451,500 |
68.4 |
9.7 |
| Morocco |
128,695 |
19.5 |
4.3 |
| Egypt |
23,407 |
3.5 |
0.34 |
| Kenya |
10,848 |
1.6 |
0.35 |
| Tanzania |
9,444 |
1.4 |
0.26 |
| Zimbabwe |
8,055 |
1.22 |
0.69 |
Mozambique |
7,670 |
1.16 |
0.80 |
| Namibia |
4,632 |
0.70 |
2.4 |
| Swaziland |
2,642 |
0.40 |
2.5 |
| Zambia |
2,610 |
0.40 |
0.23 |
| Angola |
2,480 |
0.38 |
0.18 |
| Nigeria |
2,498 |
0.38 |
0.02 |
| Botswana |
2,097 |
0.31 |
1.20 |
| Rwanda |
1,744 |
0.26 |
0.21 |
| Africa |
664,000 |
|
0.79 |
This graph shows density in the same countries (except South Africa.)
Internet hosts
per 1000 inhabitants
in 13 African
countries
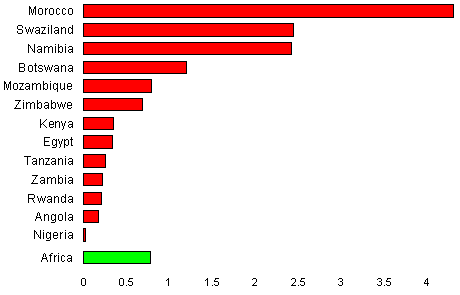
Most of Africa has density comparable to, or lower than, Nigeria. Recent
data show a higher hostcount on Morocco, that appears to be the second largest
country in the internet in the continent, though far behind South Africa.
This is the density picture seen as a map.
Internet hosts per
1000 inhabitants
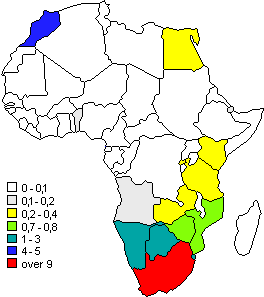
The picture is changing around the world. There are different speeds
of growth, and different density levels, in all areas, from the most
advanced (such as North America and Europe) to the least developed
(such as Africa and a large part of Asia). There is considerable potential
for growth practically everywhere.
|
|