Data

Large low-density countries
(hostcount)
Attachment to international data
One of a series of analyses
by
Giancarlo Livraghi gandalf.it
Based on statistics up to December 2005

Large low-density countries
(hostcount)
Attachment to international data
One of a series of analyses
by
Giancarlo Livraghi gandalf.it
Based on statistics up to December 2005
There was a major change in the second half of 2004 – and even more in 2005. The development in India, that we had been expexcting for several years, is beginning to happen (though density, hostcount in relation to population, is still low).
This is a short update of an analysis that was published in March 2004. The picture, at year-end 2005, shows some interesting developments – though trends always need to be understood over more extended periods.
It covers the 18 countries that in 1998 had over 50 million inhabitants and very low activity in the internet. Some of those countries can no longer be called “low density”, though so far only one (Brazil) is ahead of the world average.
Number of
hosts 2003Number of
hosts 2005Per 1000
inhab.Brazil 3,163,349 5,094,730 28,1 Mexico 1,333,406 2,555,047 24.5 Russia 800,277 1,656,352 11.4 India 86,871 838,139 0.81 Turkey 359,500 794,795 11.7 Thailand 103,700 787,342 12.2 China * 160,241 208,277 0.16 Ukraine 130,596 192,476 4.0 Egypt 22,452 86,548 1.26 Indonesia 82,979 154,586 0.71 Philippines 27,996 107,336 1.40 Pakistan 15,124 59,739 0.45 Viet Nam 340 8,265 0.10 Nigeria 1,172 2,498 0.03 Iran 496 1,147 0.02 Bangladesh 2 296 0.002 Congo 153 1,516 0.04 Ethiopia 9 87 n.a. * not incuding Hong Kong (see Chinese area)
In some of these countries the situation has changed radically, compared to a few years ago – or there are strong changes, indicating that growth may be on its way. In others internet activity remains extremely low – especially where (in addition to poverty and low living standards) freedom of information and communication is severely repressed.
This graph updates changes in seven “large” countries that now have over 10,000 internet hosts and density below ten hosts per thousand inhabitants.
Seven countries – growth
(number of internet hosts)
The red part of bars shows growth in two years (from 2003 to 2005)
The period (a year and a half) is too short to allow a clear perception in situations like these. But some countries (especially India) have very fast growth (while China, that had been growing in previous years, now appears almost static.) It will take another year, or more, to understand the evolution of these trends.
We can look at the same picture as a percentage. The graph includes the ten countries, of those considered here, that now have over 10,000 internet hosts (excluding Brazil and Mexico, that can no longer be called “low density”.)
Ten countries – growth
(percentages)
The red part of bars shows growth in two years (from 2003 to 2005)
The accuracy of data is always questionable – and some changes aren’t easily explained. But there is remarkable evolution. Eight of these countries are growing faster that the world average. And some have extraordinary increases at this time. India is the fastest growing country worldwide in 2004-2005.
The next graph shows density (hosts per 1000 inhabitants) in the same ten countries.
Ten countries – density
internet hosts per 1000 inhabitants)
Three of these countries, though they are still far below the world average, are no longer in the depth of “low density” that remains a problem in a large part of the world.
There are large differences also in a different picture, based on hostcount in relation to income (GDP.)
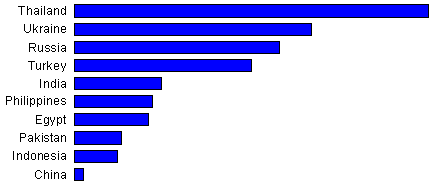
Ten countries – in relation to income
(internet hosts compared to GDP – gross domestic product)

In relation to the size of its economy, as measured by GDP, Thailand appears to have higher online activity than some “large” European countries (see international data.)
If India had a proportion of hostcount to income close to the UK or Japan, the result would be over two million internet hosts – and, if the recent trend continued, that could actually happen in a few years. China, on the same score, could have between four and six million hosts – but repression, centralization and censorship are hard to overcome.
Obviously these are only a few examples of a situation that involves many “large” or “small” countries. But they show how there are big differences, and changing trends, in all areas – from the least developed to the most advanced.
(In addition to international data there are analyses
of the situation in Asia and Africa)
This is the report that was published
in March 2004 based on data up to December 2003
In issue 31 (February 1999) of NetMarketing I published the results of an analysis, that had started two years earlier, on “large low-density countries” It wasn’t updated in following years because other documents, that were being added in this data section, helped to understand the global picture. The dismaying fact was that, in some of those countries, the situation wasn’t changing – or it was getting worse in proportion to the general growth of the internet (most readers, anyhow, seem more interested in what is happening at the higher end of the scale.)
But I guess it’s time to take another look. Some things did change in five years. The most obvious fact is that the gap has increased. Some of those countries no longer have “low density”, while others are lagging behind. Of course it’s arbitrary, as it was five years ago, to draw the line at 50 million inhabitants. And of course what is happening in many other countries, regardless of size, is important. But this is just a way of showing, with a few examples, how different the situations are around the world.
Here is a summary of how things have changed in five years, from 1998 to 2003, in the 18 countries considered in this analysis. (The first four are no longer in the “low density” category, but they are included here for the sake of comparison with five years earlier.)
number of
hosts 2003times growth
in 5 yearsper 1000
inhabit.Brazil 3,163,349 x 14.7 18.6 Mexico 1,333,406 x 11.8 13.7 Russia 800,277 x 4.8 5.5 Turkey 359,500 x 11.1 5.7 China * 160,241 x 9.3 0.12 Ukraine 130,596 x 8.3 2.6 Thailand 103,700 x 5.0 1.7 India 86,871 x 6.6 0.09 Indonesia 62,035 x 4.0 1.0 Philippines 27,996 x 3.0 0,4 Egypt 22,452 x 10.7 0.3 Pakistan 15,124 x 4.9 0.1 Nigeria 1,172 x 2.9 0.01 Iran 496 x 2 0.008 Vietnam 340 x 10 0.004 Congo 153 n.a. 0.003 Ethiopia 9 n.a. n.a. Bangladesh 2 n.a. n.a. * Not including Hong Kong (see Chinese area)
Worldwide hostcount in 2003 is 5.4 times larger than it was in 1998.
Average density is getting close to 15 hosts per 1000 inhabitants.
Seven of these countries have faster-than-average growth,
six are slower, in five figures are too small to be comparable.
There is growth in several countries, but only two (Brazil and Mexico) have reached a level that can lo longer be called “low” (in this section there a document on large laguage communities that includes an update of internet development in Latin America.)
Russia and Turkey are far below the world average, but they are considerably above the level of less developed countries – as we know from European and international data.
In other countries, even when the growth factors are high, total numbers and density remain very low.
The following graphs include the 12 countries, of these 18, that five years ago had over a thousand internet hosts and now have over 20,000.
They can’t be all placed in one graph, because differences are too large. The first group includes four countries with densities that are no longer “low” – between 5 and 20 hosts per 1000 inhabitants.
Four countries
(thousands of internet hosts)
The red part of bars shows growth in five years (from 1998 to 2003)There is remarkable growth. The fastest is Brazil – now one of the eight largest countries in the internet worldwide. Mexico has overtaken Russia (and also several countries that were traditionally strong online – as we have seen in international data.)
In the second graph the situation is different. We see three “large countries” with densities between 1 and 3 hosts per 1000 inhabitants. One in Europe, two in Asia.
Three countries
(thousands of internet hosts)
The red part of bars shows growth in five years (from 1998 to 2003)There are different speeds of growth – all retalively high, in a five-year period, as a percentage. But levels remain low in relation to population.
In the third graph we see five countries with very low density – between 0.09 e 0.5 hosts per thousand inhabitants. Four in Asia, one in Africa.
Five countries
(thousands of internet hosts)
The red part of bars shows growth in five years (from 1998 to 2003)
Hong Kong is not included in ChinaThe fastest growth, as a percetage, is in Egypt. – followed by China and India. There are different reasons why internet development is very low in the world's two largest countries. (In the analysis of language communities there are data about Chnese-speaking countries – and at the end there is a map of the situation in Asia.)
While in China there is severe political repression, there are other problems in India (not only poverty, but also bureaucratic and organizational problems that stand in the way of internet development.) This is a very complex situation, but it’s hard to understand why a country with a billion inhabitants, more English-speaking people than the British islands, and high levels of technical and cultural competence in larger numbers than most countries worldwide, has fewer internet hosts than Iceland with less than 300,000 inhabitants. The entire Indian “sub-continent” has just over 100,000 internet hosts.
In the other six “large countries” the level of online activity is extremely low. In Nigeria the number of internet hosts increased from 419 in 1998 to 1172 in 2003, but density is 0,01 per thousand inhabitants. In a large part of Africa things aren’t any better (see The intenet in Africa.) But Nigeria, with over 100 million inhabitants, has fewer internet hosts than some small African countries.
In Vietnam the number of hosts increased, in five years, from 34 a 340, in Iran from 244 to 496. These would be tiny numbers even in countries with a much smaller population. We know that is both these countries, as in many others, freedom of speech and communication are heavily repressed.
Internet activity in Congo is extremely low, and it’s even worse in Ethiopia, where the number of hosts appears to have decreased from 78 in 1998 to 9 in 2003. No internet hosts were found in Bangladesh in 1998, and now there appear to be two. Several other countries, in Africa and Asia, are close to zero hostcount.
These, of course, are only a few examples of a great variety of situations around the world. There is considerable global development of the internet, with some countries growing much faster than average, while others are slower. A large part of the world still has very limited access to the net – as we know from international data.
Other data analyses


Europe Italy Language communities