Other articles on similar
subjects
are published in English
in the
Offline
column
|

|
Italy
online |
|
|
Statistics are often unreliable or confusing (or both.)
In ten years of analyzing internet data, there were several
circumstances in which figures appeared contradictory
– but over time trends became more coherent. At
this time, some figures for Italy are somewhat puzzling.
However some facts are clear. The net continues to
grow, in most parts of the word, with considerable
speed (over 20 percent a year.) But also with differences,
that change over time but remain very large, between the
highly developed areas and those that are far behind (not
only entire nations, but also demographic, social and
cultural categories within each country.)
There have always been “some” Italians
online. For instance, several years before internet connections
became widely available, there were two thousand
BBSs in Italy. A small number compared
to the United States, but larger that in many other countries.
If we look at hostcount, this is the development in Italy
from 1996 to 2006 (in earlier years growth was proportionally
higher, but numbers were small an the trend would appear
“ flat” in the graph – see the
Italian version
of this issue, and the Italian
data analysis, for more details.)
Internet
hosts Italy –
1996-2006
Sixmonthly
data, numbers in thousands
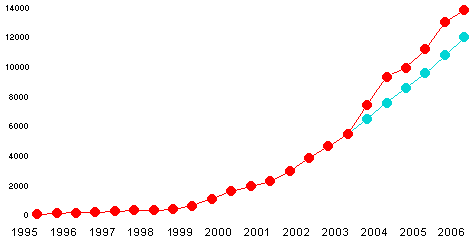
The
pale blue line shows an “arbitrary but not unreasonable”
reduction
of data to a more “prudent” size
I must admit that, so far, I haven’t been able to
understand why the trend has been “peculiar”
from 2004 to 2006. There were doubtful figures for other
countries that became more reasonable over time. I hope
the same will happen for Italy in the next few years. In
the meantime, it’s reasonable to work with more
“careful” figures (pale blue line in the graph)
as I am doing in these analyses. In any case, in the last
seven years Italy has faster growth than the world average,
but remains far behind the most advanced countries in
proportion to population and income.
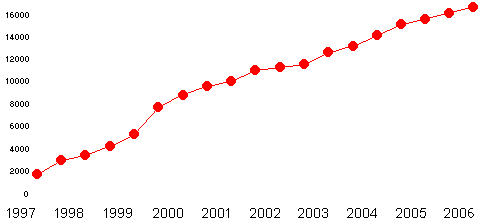
The growth trend is slower if we look at the number
of people online. Of course such data aren’t very
reliable and different sources report different figures.
But it’s reasonable to believe the trend shown
in this graph is fairly close to reality (see
Italian data.)
People
online in Italy –
1997-2006
Sixmonthly
data, numbers in thousands
It’s happening also in other parts of the world: activity
online is growing faster than the number of people using the net.
But there is a peculiar weakness in Italy (several sources
confirm that in 2006 it was overtaken by France and Spain
by number of internet “users” as a percentage
of population.) This is part of a wider problem in Italy: too
many people, while not totally “illiterate”, are
“poor” in the use of information and communication
resources (except for television and a widespread use of mobile phones.)
Time will tell. But there is a cultural (not “digital”)
divide that is keeping a large part of Italy’s population
(somewhere between half and one third) away from an active and
effective role in information and communication systems.
In the Italian part of this website there are several documents
discussing this problem in greater depth.
As usual, more detailed reports on the situation worldwide,
in Europe and in other parts of the world are in the
data section. Short reports
here (as in previous issues of this newsletter) for the situation
worldwide – and in Europe, Latin America, Asia and Africa
– will remain for “historical comparison” when
those analyses are updated (probably in the third quarter of 2007.)
back
to top
|

|
2. New international data |
|
|
Over 430 million internet hosts were found active
worldwide at the end of 2006. (The total exceeded 100
million in year 2000, 200 in 2003 and 300 in 2004.)
At first glance, there seems to be something very strange.
For the first time in the history of the internet, there appears
to be a decrease in the total number of hosts worldwide
at the end of 2996 compared to six months earlier. But a more
careful look at the data shows that it isn’t so. There
was only an adjustment of the host counting in some large
TLDs that are used mostly in the United
States. Actual wordlwide growth was 25 percent over a year earlier.
As shown in the analysis of international
data this is the evolution from 1994 to 2006.
| |
Number
of hosts |
annual
growth |
| 1994 |
5,800,000 |
+ 119 % |
| 1995 |
12,900,000 |
+ 104 % |
| 1996 |
21,800,000 |
+ 52 % |
| 1997 |
29,700,000 |
+ 36 % |
| 1998 |
42,200,000 |
+ 46 % |
| 1999 |
72,400,000 |
+ 68 % |
| 2000 |
109,600,000 |
+ 51 % |
| 2001 |
147,300,000 |
+ 35 % |
| 2002 |
171,600,000 |
+ 17 % |
| 2003 |
233,100,000 |
+ 36 % |
| 2004 |
317,646,000 |
+ 36 % |
| 2005 |
394,992,000 |
+ 24 % |
| 2006 |
433,193,199 |
+ 25 % |
2006 percent
growth
excluding the United States.
Of course, with larger numbers, percentages can’t
be as large as they were in the nineties, but growth continues
to be very fast. This chart shows the broad picture by
“large geographic areas”.
Large
geographic areas
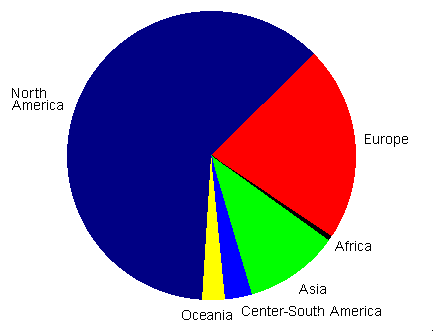
In 2006 growth was faster in Central-South America than
in North America, Europe and Asia. Africa had fast percentage
growth, but remains severely undeveloped (as a large part of Asia.)
In 1999 there were six countries worldwide with over
a million internet hosts (two in Europe.) In year 2000 there
were ten (four in Europe.) In 2001 thirteen (four in Europe.)
In 2005 twentysix (sixteen in Europe) and in 2006 thirtyfour
– twenty in Europe, six in Asia, five in the Americas,
two in Oceania and one in Africa.
This table updates the data for the 34 countries (of 240)
with over a million internet hosts.
| |
Number of hosts
December 2006 |
% growth
in a year |
% of
total |
Per 1000
inhab. |
| United States |
230,600,000 |
n.a. |
53.3 |
777.9 |
| Japan |
30,841,523 |
+ 23.8 |
7.1 |
241.4 |
| Germany |
13,093,255 |
+ 32.9 |
3.0 |
158.7 |
| United Kingdom |
13,000,000 |
n.a. |
3.0 |
216.5 |
| Italy |
12,000,000 |
+ 23.4 |
2.8 |
204.2 |
| France |
10,335,974 |
+ 50.6 |
2.4 |
169.8 |
| Netherlands |
9,104,103 |
+ 25.4 |
2.1 |
558.1 |
| Australia |
8,592,020 |
+ 41.2 |
2.0 |
422.7 |
| Canada |
8,500,000 |
n.a. |
2.0 |
263.4 |
| Brazil |
7,422,440 |
+ 45.7 |
1.7 |
40.3 |
| Spain |
6,800,000 |
n.a. |
1.5 |
154.7 |
| Mexico |
6,697,570 |
+ 161.4 |
1.5 |
65.0 |
| Poland |
5,001,786 |
+ 26.9 |
1.2 |
131.0 |
| Taiwan |
4,481,705 |
+ 13.6 |
1.0 |
194.1 |
| Sweden |
3,235,925 |
+ 7.3 |
0.8 |
358.4 |
| Finland |
3,187,643 |
+ 27.2 |
0.7 |
606.5 |
| Belgium |
3,150,856 |
+ 23.7 |
0.7 |
300.9 |
| Switzerland |
2,570,891 |
+ 21.0 |
0.6 |
345.6 |
| Denmark |
2,807,348 |
+ 21.2 |
0.6 |
518.8 |
| Norway |
2,370,078 |
+ 12.4 |
0.5 |
512.7 |
| Russia |
2,393,511 |
+ 44.5 |
0.6 |
16.7 |
| Austria |
2,330,325 |
+ 19.1 |
0.5 |
283.3 |
| China |
1,933,919 |
+ 828.5 |
0.4 |
1.48 |
| Argentina |
1,837,050 |
+ 25.4 |
0.4 |
47.6 |
| India |
1,684,958 |
+ 101.0 |
0.4 |
1.54 |
| Turkey |
1,581,866 |
+ 99.0 |
0.4 |
21.9 |
| Portugal |
1,510,958 |
+ 9.6 |
0.3 |
143.5 |
| Czech Rep. |
1,502,537 |
+ 51.2 |
0.3 |
147.0 |
| New Zealand |
1,355,534 |
+ 37.74 |
0.3 |
330.7 |
| Israel |
1,311,796 |
+ 8.2 |
0.3 |
190.9 |
| Ireland |
1,208,345 |
n.a. |
0.3 |
294.1 |
| Hungary |
1,176,529 |
+ 31.5 |
0.3 |
116.5 |
| Romania |
1,169,031 |
+ 161.7 |
0.3 |
54.1 |
| South Africa |
1,036,891 |
+ 108.8 |
0.2 |
22.1 |
| Total * |
433,193,199 |
+ 25.1 |
|
33.3 |
Figures
for some contries are adjusted for coherence.
See
internatiopnal data.
* World density and growth
percentage excluding the United States
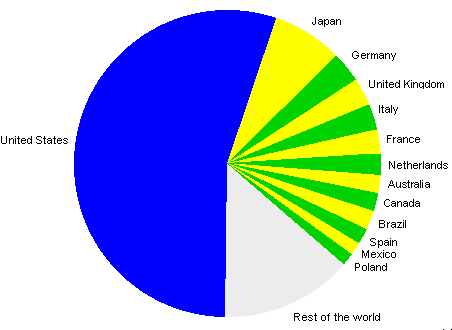
The percentage of the United States has been decreasing, but it is
still dominant, with 53 percent of the world total, as we see in this graph
(countries with over five million internet hosts.)
Internet
hosts in 13 countries
countries
worldwide with over five million hosts
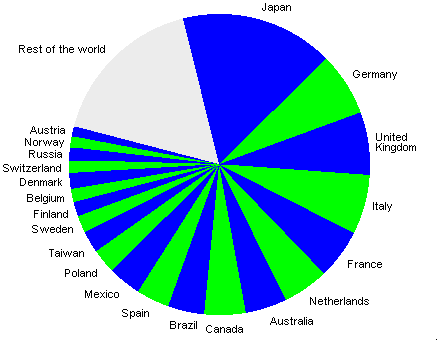
If we exclude the United States, this is the picture for
the other 22 countries with over two million internet hosts.
Internet
hosts in 22 countries
countries worldwide with over
two million hosts (US excluded)
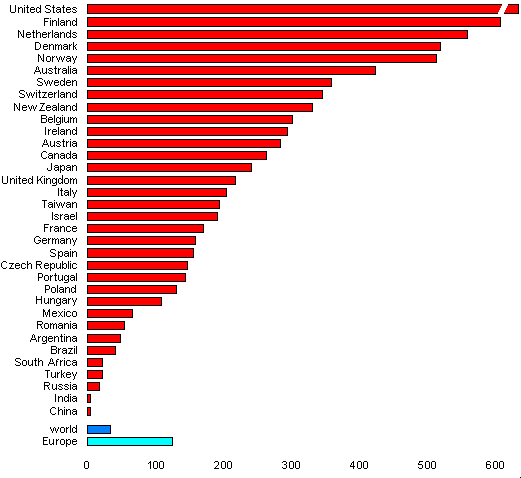
This is an update of the graph for density (hosts per 1000 inhabitants)
in the 34 countries worldwide with over a million internet hosts.
Internet
hosts per 1000 inhabitants in 34 countries
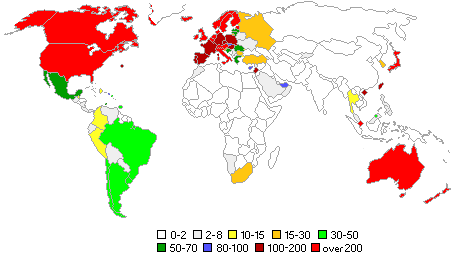
And here is a picture of internet density as a world map.
Internet
hosts per 1000 inhabitants
More detailed analyses and comments, including
a graph of hostcount in relation to income, are in the
international data report.
back to top
|

|
3. New European data |
|
|
Total European houscount exceeded 30 million in 2003,
50 in 2004 and 70 nel 2005. Now it’s getting close
to 90 million. At this time growth in Europe (+ 22 percent in
a year) appears to be slower than the world average (+ 25 percent.)
There are some further changes in the internet in Europe
compared to a year earlier (issue
77.) As usual, a more detailed report is in
European data.
This is an update of the situation in the 30 European
countries with over 100,000 internet hosts.
| |
Number of hosts
December 2006 |
% of
Europe |
Per 1000
inhab. |
| Germany |
13,093,255 |
14.9 |
158.7 |
| United Kingdom |
13,000,000 |
14.8 |
216.5 |
| Italy |
12,000,000 |
13.7 |
204.2 |
| France |
10,335,974 |
11.8 |
169.8 |
| Netherlands |
9,104,103 |
10.4 |
558.1 |
| Spain |
6,800,000 |
7.8 |
154.7 |
| Poland |
5,001,786 |
5.7 |
131.0 |
| Sweden |
3,236,000 |
3.7 |
358.4 |
| Finland |
3,187,643 |
3.6 |
606.5 |
| Belgium |
3,150,856 |
3.6 |
300.9 |
| Denmark |
2,807,348 |
3.2 |
518.8 |
| Switzerland |
2,570,891 |
2.9 |
345.6 |
| Norway |
2,370,078 |
2.7 |
512.7 |
| Russia |
2,393,511 |
2.7 |
16.7 |
| Austria |
2,330,325 |
2.7 |
254.4 |
| Portugal |
1,510,958 |
1,7 |
143.5 |
| Czech Republic |
1,502,537 |
1.7 |
147.0 |
| Ireland |
1,208,345 |
1.4 |
294.1 |
| Hungary |
1,176,592 |
1.3 |
116.5 |
| Romania |
1,169,031 |
1.3 |
54.0 |
| Greece |
797,884 |
0.9 |
72.0 |
| Slovakia |
486,020 |
0.6 |
90.3 |
| Estonia |
449,036 |
0.5 |
333.1 |
| Ukraine |
274,365 |
0.3 |
5.9 |
| Croatia |
261,786 |
0.3 |
58.7 |
| Lithuania |
240,592 |
0.3 |
70.7 |
| Bulgaria |
220,466 |
0.3 |
28.4 |
| Iceland |
209,071 |
0.2 |
697.1 |
| Slovenia |
160,000 |
0.2 |
80.0 |
| Latvia |
132,204 |
0.15 |
57.5 |
| European Union |
79,268,000 |
90.5 |
161.6 |
| Europe |
87,606,000 |
|
123.9 |
Figures for
the UK, Spain and Slovenia are “arbitrarily
but not unreasonably” adjusted
to compensate for
underestimated hostcount data in this period.
The figure
for Italy, that appears overestimated
in the hostcount survey in
recent years, here is reduced by 13 percent.
In the last two years growth was faster in France (that has
overtaken the Netherlands in 2006.) Strong development continues
in Poland and in other eastern European countries.
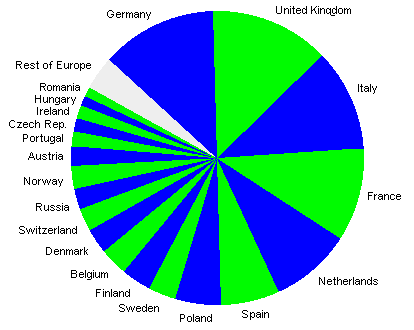
This “pie” graph shows the situation, at the
end of 2006, for the 20 European countries with over a million
internet hosts (that have 96 % of the total hostcount in Europe.)
Internet
hosts in 20 European countries
countries with over a million
hosts
This is an update of density (hosts per 1000 inhabitants)
for the 30 European countries with over 100,000 internet hosts.
Internet hosts
per 1000 inhabitants
in 30 European countries
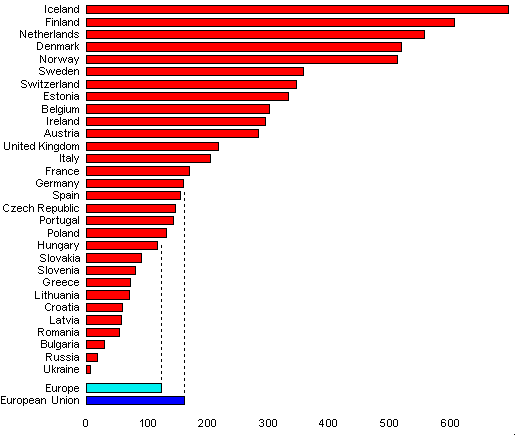
And this is the picture as a map.
Internet hosts
per 1000 inhabitants 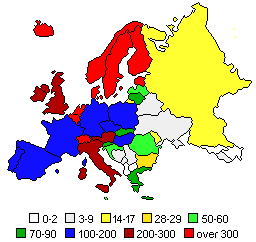
The internet is growing almost everywhere in Europe, but the highest
density remains in the Scandivavian area and in the Netherlands.
back to top
|

|
4. Latin
America, Asia and Africa |
|
|
An analysis of large
language communities in the data section includes
information on the development of the internet in Latin
America – that in 2005, for the first time, exceeded
10 million internet hosts and in 2006 grew to 18 million.
In this chart we see the situation in the 17 countries
with over 10,000 hosts (that have over 99 percent of the
total hostcount in Latin America.)
| |
Number of hosts
December 2006 |
Per 1000
inhab. |
| Brazil |
7,422,440 |
40.3 |
| Mexico |
6,697,570 |
65.0 |
| Argentina |
1,838,050 |
47.6 |
| Colombia |
721,114 |
15.7 |
| Chile |
621,565 |
38.2 |
| Peru |
269,981 |
9.9 |
| Uruguay |
182,403 |
56.0 |
| Venezuela |
122,404 |
4.6 |
| Dominican Rep. |
98,180 |
10.9 |
| Guatemala |
49,062 |
4.0 |
| Ecuador |
27,923 |
2.1 |
| Nicaragua |
24,690 |
4.5 |
| Bolivia |
20,085 |
2.3 |
| Paraguay |
13,178 |
2.4 |
| Costa Rica |
12,751 |
3.0 |
| El Salvador |
12,429 |
1.1 |
| Panama |
9,626 |
3.1 |
| Latin America |
18,150,000 |
34.6 |
Latin America has very fast growth. 70 percent in a year
(as compared to 25 percent world average.) There are
several changes, including strong development in Mexico.
Nearly 99 percent of the total hostcount in Latin America
is in nine countries, as we see in this graph.
9
countries in Latin America
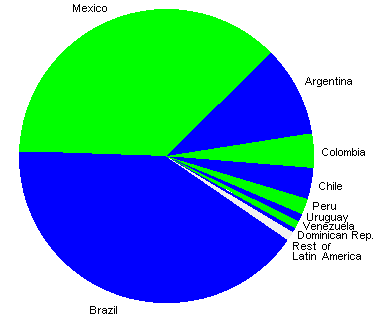
82 % of the total is in three countries: Brazil, Mexico and Argentina.
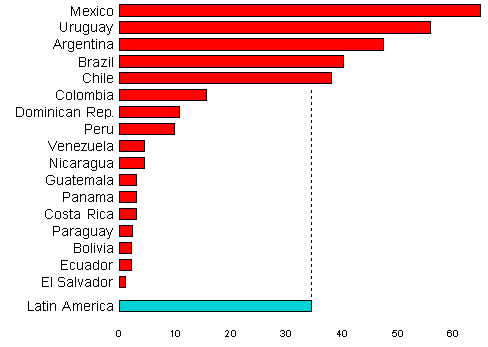
The next graph shows density (internet hosts per thousand inhabitants)
in 17 countries with over 10,000 hosts.
Internet
hosts per 1000 inhabitants
in 17 Latin American countries
And this is the picture as a map.
Internet
hosts per 1000
inhabitants
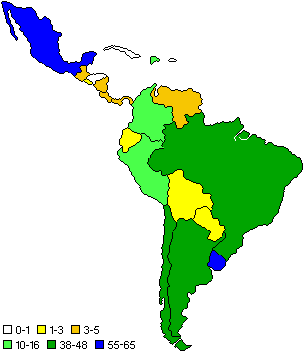
The same five countries as in past years (Mexico, Uruguay, Argentina,
Brazil and Chile) remain ahead of general density in the area (and above the world
average.) But also in other parts of Latin America there is relevant growth.
This is a summary of a document in the data section
that covers the situation in Asia.
The chart includes the 24 countries with over 10,000 internet
hosts (that have over 99 percent of the total hostcount in Asia.)
| |
Number of hosts
December 2006 |
% of Asia |
Per 1000
inhab. |
| Japan |
30,841,523 |
73.2 |
241.4 |
| Taiwan |
4,418,705 |
10.5 |
194.1 |
| China |
1,933,919 |
4.6 |
1.49 |
| India |
1,684,958 |
4.0 |
1.54 |
| Turkey |
1,581,866 |
3.8 |
22.0 |
| Israel |
1,311,796 |
3.1 |
182.4 |
| South Korea |
1,000,000 |
2.4 |
20.3 |
| Thailand |
938,784 |
2.2 |
14.5 |
| Singapore |
909,284 |
2.2 |
255.9 |
| Hong Kong |
801,298 |
1.9 |
116.4 |
| Arab Emir. |
337,092 |
0.80 |
73.281 |
| Indonesia |
257,671 |
0.61 |
1.17 |
| Philippines |
243,663 |
0.58 |
2.9 |
| Malaysia |
167,449 |
0.40 |
6.4 |
| Pakistan |
98,147 |
0.23 |
0.65 |
| Cyprus |
75,846 |
0.18 |
101.26 |
| Saudi Arabia |
68,532 |
0.16 |
2.9 |
| Kirghizstan |
29,196 |
0.07 |
5.7 |
| Kazakhstan |
25,411 |
0.06 |
1.67 |
| Lebanon |
19,968 |
0.05 |
5.2 |
| Nepal |
18,640 |
0.04 |
0.74 |
| Jordan |
16.032 |
0.04 |
2.9 |
| Brunei |
15,255 |
0.04 |
41.7 |
| Viet Nam |
12,956 |
0.03 |
0.16 |
| Asia |
42,150,000 |
|
10.8 |
For the first time in 2004, with a fast increase of
hostcount, India had overtaken China. The trend
continued in 2005 and 2006. In the second half of
2006 there was a “sudden” increase
in China. It will probably take a few more years to
understand these developments.
Japan is still dominant in Asia, as we see in this
“pie” (countries with over 500,000 internet hosts.)
10
countries
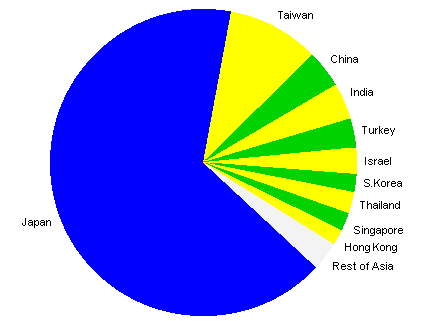
These countries have 97 percent of the total hostcount in the continent.
The first six, with six percent of the population, have nearly 90 percent
of the internet activity in Asia.
If we remove Japan from the graph. this is the situation in
the other 13 countries in Asia with over 100,000 internet hosts.
13
countries
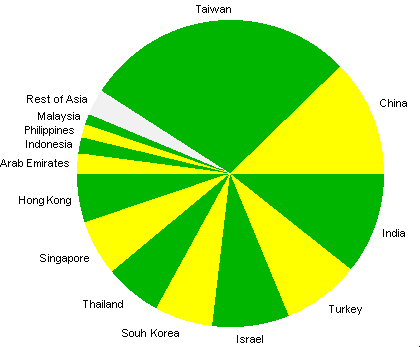
Taiwan, with 0.6 percent of the population, still has over ten
percent of the total hostcount in Assia. But the picture is changing,
with growth not only in India and China, but also in other countries.
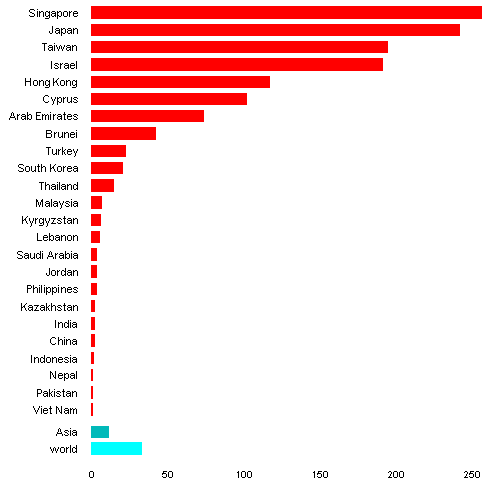
There are great differences in Asia, as shown by this
graph – internet hosts per 1000 inhabitants in 24
countries with over 10,000 internet hosts.
Internet
hosts per 1000
inhabitants
in 24 countries in Asia
This is the picture as shown in a map of the central and southern
part of the continent – from the Middle East to East Asia.
Internet
hosts per 1000
inhabitans
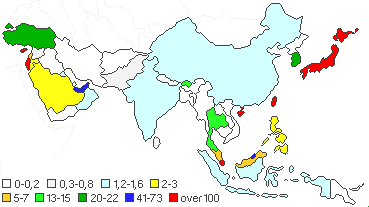
Some data on the Chinese area are included in the analysis of
language communities.
Another document in the data section is an analysis
of the internet in Africa.
Here is a summary of the situation at year-end 2006. The
table includes the 21 African countries with over a thusand
internet hosts (that have 99 percent of the total in the continent.)
| |
Number of hosts
December 2006 |
% of
Africa |
Per 1000
inhab. |
| South Africa |
1,036,891 |
68.1 |
22.1 |
| Morocco |
268.601 |
17.6 |
9.0 |
| Egypt |
89,063 |
5.9 |
1.29 |
| Tanzania |
17,516 |
1.15 |
0.47 |
| Kenya |
14,663 |
0.96 |
0.47 |
| Zimbabwe |
13,814 |
0.91 |
1.16 |
Mozambique |
12,948 |
0.85 |
0.67 |
| Mauritius |
9,654 |
0.63 |
8.19 |
| Ghana |
7,420 |
0.49 |
0.35 |
| Zambia |
7,420 |
0.49 |
0.35 |
| Botswana |
5,815 |
0.38 |
3.3 |
| Angola |
5,533 |
0.36 |
0.36 |
| Namibia |
4,632 |
0.30 |
2.3 |
| Swaziland |
2,642 |
0.17 |
2.4 |
| Ivory Coast |
2,580 |
0.17 |
0.14 |
| Nigeria |
2,498 |
0.16 |
0.02 |
| Congo |
1,894 |
0.12 |
0.03 |
| Madagascar |
1,868 |
0.14 |
0.11 |
| Rwanda |
1,744 |
0.11 |
0.20 |
| Uganda |
1,365 |
0.09 |
0.05 |
| Eritrea |
1,304 |
0.09 |
0.29 |
| Africa |
1,522,000 |
|
1.74 |
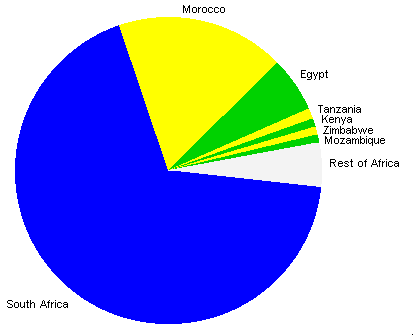
Though Morocco and other countries are growing,
South Africa remains dominant, as we see in this graph (seven African
countries with over 10,000 internet hoists, that have 95 percent of the
total in the continent.)
7
African countries
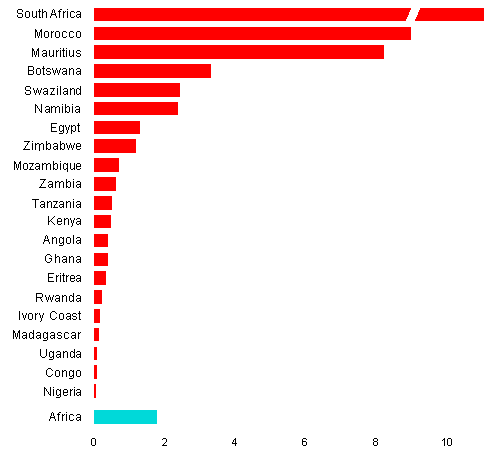
This is density as a graph – 21 African countries with
over a thousand internet hosts.
Internet
hosts per 1000
inhabitants
in 21 African countries
Two other
small insular countries,
the Seychelles e São Tomé
& Principe,
have higher density than Mauritius.
Density in most of Africa is comparable to, or below, the level
of Nigeria. In a general picture of very weak internet activity, there
are large differences also in Africa. Recent changes include the
growth of Morocco. Egypt, that was slower in previous years,
appeared to be growing again in 2005 – but still remains far
behind “European” levels.
This is the density picture as a map.
Internet
hosts per 1000 inhabitants
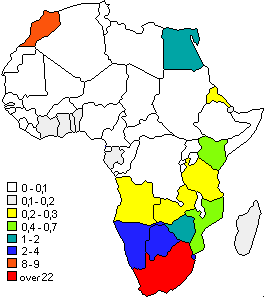
In 2006 Africa had 71 percent growth, much faster than the
25 percent world average – and, for the first time, over
a million internet hosts. But the fact remains that the entire
continent, with 14 percent of the world’s population, has
0.3 percent of the activity in the internet.
The picture is evolving everywhere. There are different
speeds of growth, and different levels of density, inside all
of the areas, from those with the highest concentration, such
as North America and Europe, to the weakest environments,
such as Africa and most of Asia. There is still large room for
development in all parts of the world.
|
|