Other articles on similar subjects
are published in English
in the monthly Offline column
|
 |
1. Editorial: The spam disease |
|
|
“Spamming” isn’t a new problem. It was
identified (and nicknamed) twenty years ago. But it’s getting
worse. While in the “traditional” internet culture
practically everyone agreed in condemning it, now some people
seem to think that it’s a good idea – especially
as a tool for business. It isn’t. And it isn’t doing
any good for business online.
Some large companies now are quite concerned, if only for
the floods of spam that are interfering with their e-mail, cluttering
and confusing their organization. But they don’t seem to
understand why that is only a part of a much bigger problem.
There have been several attempts to stop spamming, or
at least reduce it, but so far they have failed. Some authorities
(including the European Union) have acknowledged the
problem, but with no practical results. And top-down rulings
are likely to do more harm than good. They could interfere
with net freedom, create unnecessary and cumbersome
bureaucracy, while leaving the spam problem unsolved.
The disease has been made worse by a bunch of viruses (replicating
worms such as “kletz”)
that produce huge quantities of fake e-mail. And
nothing has been done to stop that infection.
It is possible to solve, or at least reduce, the spam
problem – though it isn’t easy. This is, above all, a
cultural issue. People online should be more widely, and more
clearly, aware of the problem. And companies should
understand why spam is not a good business tool. It’s used
predominantly by crooks, swindlers and peddlers of services
that nobody wants or needs.
It’s a very bad idea for any company (or person) to be
confused with spammers. Especially for anyone who needs and
wants to build relationships of trust and integrity.
Swindlers, of course, include list peddlers. They promise
to offer “selective” lists of people who want to,
or have agreed to, receive mail on specific subjects – while
that is blatantly untrue. Anyone falling into their trap is
either dishonest or stupid.
On the other hand, it’s a bit too easy to avoid the issue
by saying (as some spam advocates do) that if people are
stupid enough to be deceived that’s their problem. I know
intelligent people, with years of experience online, who have
fallen into all sorts of traps, including chain letters, fake
humanitarian causes and hoaxes. (Not all spam is
“commercial”.)
Of course the definition of spam is, to some extent,
subjective. What one person sees as acceptable or
“tolerable” can be unbearable for another (or vice
versa.) This is one of the reasons why generic and
centralized solutions don’t work (except, maybe, for the most
frequent and obviously dishonest spammers who could be quite
easily put out of business if private and public
organizations were taking the problem seriously.)
The first step is to develop a more widespread
understanding of the problem. And to provide people with the
tools (technical and cultural) to protect themselves
according to their personal criteria. Some tools do exist,
but they could (and should) be made much more effective.
Business culture should also become much more aware of
the increasing damage caused by spam. It doesn’t just clutter
personal and company mailboxes. It destroys belief, trust and
confidence in online activities – especially business. It
isn’t a “lethal” disease, but it’s a serious
infection and we are already very late in treating it effectively.
back to top
|
 |
2. New worldwide data |
|
|
In the last two years the data updates are no longer in this
newsletter but in the data section
of this site, where there are now four reports in English.
The internet worldwide
http://gandalf.it/data/data1.htm
The internet in Europe http://gandalf.it/data/data2.htm
Two large language communities http://gandalf.it/data/spanchin.htm
People online in Italy http://gandalf.it/data/data3.htm
Three other reports are only in Italian, but charts and graphs are
easily understood in any language.
Summaries of the most relevant data are included here to provide a quick update
and also to save “historical” reference. In the data section old
reports are lost with each update, while they remain available here. There are
data reports in issues 8
15
24
31
38
43
50
56
61
62
The worldwide survey that was published on August 14, 2002
reports a further hostcount increase in several countries. Some of the data
are questionable. For instance it’s hard to believe that Italy
has overtaken Germany and the UK and is now the fourth largest country
in the world (and the largest in Europe) by internet hostcount. All statistics
have problems and uncertainties. Hostcount trends are fairly consistent
and relevant over time, but this particular change can not be taken
as a “fact” until further data become availanble.
Chart and graphs (here and in the data
section) are based on statistics “as they are” but
we should consider that at this stage the figures for the UK
are probably understated and those for Italy may be overestimated.
Growth of the internet worldwide appears to be slower than in past years,
though still quite strong. This is the evolution from 1995 to 2002.
| |
Number
of hosts |
Yearly
growth |
| 1995 |
8,200,000 |
+ 107 % |
| 1996 |
16,729,000 |
+ 104 % |
| 1997 |
26,053,000 |
+ 56 % |
| 1998 |
36,739,000 |
+ 41 % |
| 1999 |
56,218,000 |
+ 53 % |
| 2000 |
93,047,000 |
+ 66 % |
| 2001 |
125,888,000 |
+ 35 % |
| 2002 |
162,128,000 |
+ 29 % |
The next chart analyzes data for the 22 countries worldwide
with over 500,000 internet hosts.
| |
Number of hosts
June 2002 |
% growth
in a year |
% of
total |
Per 1000
inhabitants |
| United States |
105,546,383 |
+ 29.6 |
65.1 |
379.1 |
| Japan |
8,713,920 |
+ 78.3 |
5.4 |
68.8 |
| Canada |
3,129,884 |
+ 16.5 |
1.9 |
100.6 |
Italy |
2,958,899 |
+ 46.8 |
1.8 |
51.6 |
| Germany |
2,923,327 |
+ 21.9 |
1.8 |
35.5 |
| Netherlands |
2,632,803 |
+ 2.0 |
1.6 |
166.6 |
| United Kingdom |
2,508,172 |
+ 6.7 |
1.6 |
42.7 |
| Australia |
2,496,683 |
+ 33.8 |
1.5 |
132.1 |
| France |
2,052,770 |
+ 46.1 |
1.3 |
34.7 |
| Brazil |
1,988,321 |
+ 94.0 |
1,2 |
11.7 |
Taiwan |
1,814,090 |
+ 41.7 |
1.1 |
82.8 |
| Spain |
1,682,434 |
+ 82.6 |
1.0 |
42.5 |
| Finland |
1,217,983 |
+ 39.6 |
0.8 |
234.2 |
| Sweden |
1,187,942 |
+ 14.4 |
0.7 |
133.5 |
| Mexico |
1,004,637 |
+ 48.9 |
0.6 |
10.2 |
| Denmark |
872,328 |
+ 61.9 |
0.5 |
164.6 |
| Belgium |
832,853 |
+ 35.7 |
0.5 |
81.7 |
| Russia |
800,277 |
+ 118.7 |
0.5 |
5.5 |
| Poland |
731,371 |
+ 39.3 |
0.5 |
18.9 |
| Austria |
720,587 |
+ 19.9 |
0.4 |
87.9 |
| Switzerland |
667,509 |
+ 28.8 |
0.4 |
90.2 |
Norway |
634,098 |
+ 7.4 |
0.4 |
140.9 |
| Total |
162,128,493 |
+ 28.8 |
|
9,3 |
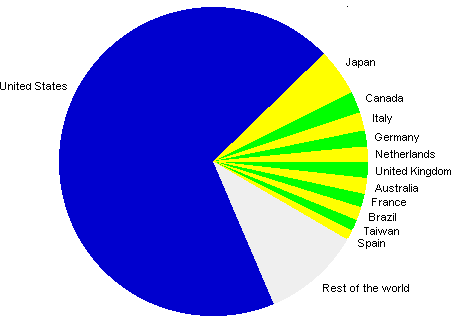
This graph shows the situation in June 2002 for the 12 countries with over 1.5 million internet hosts.
Internet hosts in 12 countries
countries worldwide with over 1.5 million hosts
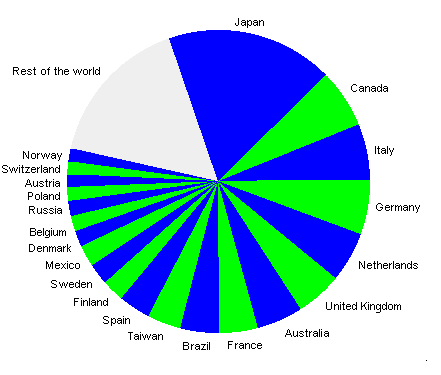
If we exclude the US, this is the picture for the other 21 countries with over 500,000 internet hosts.
Internet hosts in 21 countries
countries worldwide with over 500,000 hosts (United States excluded)
Growth speeds are very different, as we see in this chart conparing 10 of the 12 countries with
over 1.5 million internet hosts (US and Japan excluded for better readability of the graph.)
Internet hosts
numbers in thousands

The red part of bars shows growth in two years (2000 to 2002)
The differences are even more obvious in the next graph, where development stages are shown as percent of the total.
Internet hosts
Percentages

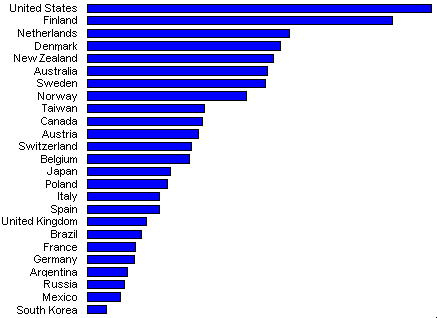
The next graph shows density (hosts per 1000
inhabitants) in 25 countries with over 400,000 internet hosts.
Internet hosts per 1000 inhabitants in 25 countries

As usual, here is the worldwide density picture as a map.
Internet hosts per 1000 inhabitants

This is the situation in relation to income for the 25 countries with over 400,000 internet hosts.
Internet hosts in relation to income (GDP)
in 25 countries
More detailed charts, graphs and comments are in the worldwide data report.
Another analysis on this site shows the growing online activity in two language communities (Spanish and Chinese.) In that context there is an approximate estimate of the nine most relevant lanuages in the internet.
Languages in the internet
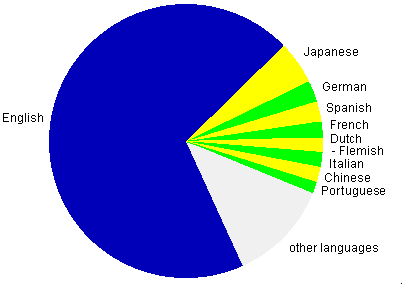
English is obviously domiunant, but other languages are relevant.
Especially those spoken in several countries, such as German and French,
with a high growth potential for Spanish and Chinese.
A full update will probably be available in the first quarter of 2003.
back to top
|
 |
3. New European data |
|
|
A more detailed analysis is in the
European data section. For “historical ”
reference see issues 8 13 24 29 30 36 43 50 56 60 62
There are 24 million internet hosts in Europe. With this growth
pattern from 1990 to 2002.
1990 – 29,200
1991 – 129,700
1992 – 284,400
1993 – 553,400
1994 – 1,029,300
1995 – 2,206,400
1996 – 3,674,300
1997 – 5,790,000
1998 – 7,872,000
1999 – 10,268,000
2000 – 15,804,000
2001 – 22,332,000
2002 – 24,237,000 (half year)
This is the situation in mid-year 2002 for the 21 European countries
with over 100,000 internet hosts.
| |
Number of hosts
June 2002 |
% of
Europe |
Per 1000
inhabitants |
| Italy |
2,958,899 |
12.2 |
51.6 |
| Germany |
2,923,327 |
12.1 |
32.6 |
| Netherlands |
2,632,803 |
10.9 |
166.6 |
| United Kingdom |
2,508,172 |
10.4 |
42.7 |
| France |
2,052,770 |
8.5 |
34.7 |
| Spain |
1,682,434 |
7.0 |
42.5 |
| Finland |
1,217,983 |
5.0 |
234.2 |
Sweden |
1,187,942 |
4.9 |
133.5 |
| Demark |
872,328 |
3.6 |
164.6 |
| Belgium |
832,853 |
3.5 |
81.7 |
| Russia |
800,277 |
3.3 |
5.5 |
| Poland |
731,371 |
3.0 |
18.9 |
| Austria |
720,587 |
3.0 |
87.9 |
| Switzerland |
667,509 |
2.8 |
90.2 |
| Noway |
634,098 |
2.6 |
140.9 |
| Czech Republic |
362,083 |
1.5 |
36.2 |
Portugal |
266,991 |
1.1 |
27.0 |
| Hungary |
228,303 |
0.9 |
22.8 |
| Greece |
184,716 |
0.8 |
17.4 |
| Ukraine |
130,569 |
0.6 |
2.6 |
| Ireland |
130,487 |
0.6 |
35.3 |
| European Union |
20,136,164 |
83.1 |
53.9 |
| Europe |
24,236,913 |
|
34.5 |
As pointed out in the comments on worldwide data, it’s
unlikely that Italy can really have the largest hostcount in Europe. I’s
probably in third place, after Germany and the UK – but even so
it’s a big change compared three or four years ago.
Here again, graphs are based on data “as they are”
but we should bear in mind that at this stage the figures for the UK
are probably understated and those for Italy may be overestimated.
In spite of that problem, trends over time remain consistent and meaningful
and comparisons between countries are quite relevant.
This graph summarizes the picture for the 15 European countries with
over 500,000 internet hosts.
15 European countries

There are considerable differences in growth speed, as we see in this graph.
Internet hosts in 15 European countries
numbers in thousands
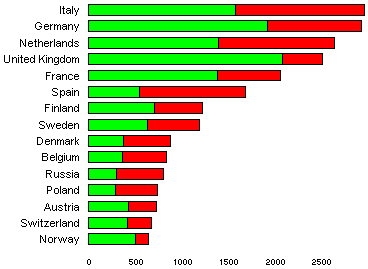
The red part of bars shows growth in two years (2000 to 2002)
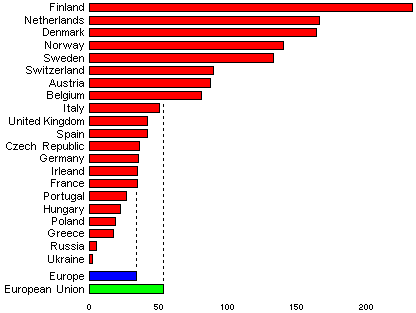
This is the density (hosts per 1000 inhabitants) in the European countries
with over 100,000 internet hosts.
Internet hosts per 1000 inhabitants
in 21 European countries
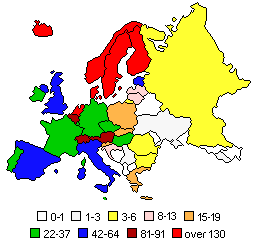
As usual, here is the densitúy picrure as a map.
Internet hosts per 1000 inhabitants
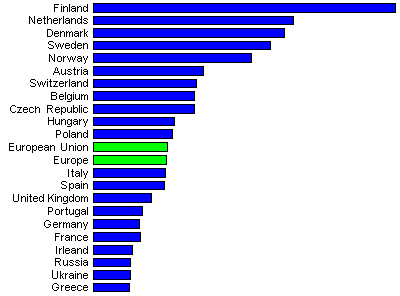
This is the situation in relation to income in the European countries
with over 100,000 internet hosts.
Host internet in relation to income (GDP)
in 21 European countries
For more details, and comments, see the European data report.
New European statistics are available every month, but short-term changes
often aren’t relevant. There will not be other updates here this year unless
there are major developments worth reporting.
|
|