| |
Number of hosts |
% growth |
| in six months |
in a year |
| January 1995 * |
5,846,000 |
51.1 |
118.9 |
| July 1995 * |
8,200,000 |
40.3 |
106.8 |
| July 1996 * |
16,729,000 |
16.6 |
104.0 |
| January 1997 * |
21,819,000 |
30.4 |
52.0 |
| July 1997 * |
26,053,000 |
19.4 |
55.7 |
| January 1998 |
29,670,000 |
13.9 |
36.0 |
| July 1998 |
36,739,000 |
23.8 |
41.0 |
| January 1999 |
43,230,000 |
17.7 |
45.7 |
| July 1999 |
56,218,000 |
30.0 |
53.0 |
| * The survey methodology was changed starting January 1998. Figures for years
1995-1997 are asjusted to adapt the old criteria to the new.
Percentages for 1995 over 1994 are based on the "old" data.
Growth in January 1994 over a year earlier was 138 percent. |
The growth trend is up-and-down, with a faster
increase in the last six months. Let's look at an update of
the graph that compares growth in Europe (RIPE data)
and worldwide.
Growth trend of internet hosts
January 1995 = 100
Six-month periods (January and July of each year)
Anallysis on data by Network Wizards and RIPE (Réseaux IP Européens)
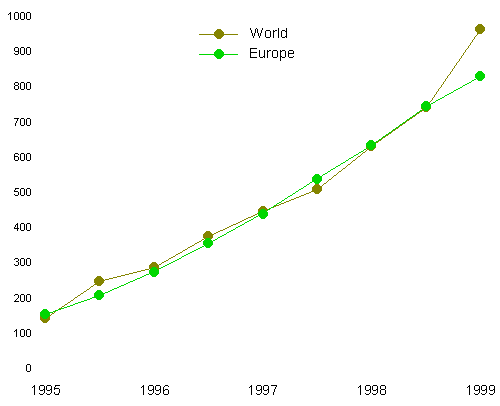
For several years the growth rate was almost the same,
but now "the rest of the world" is faster than
Europe. There is some relevant growth in several non-European
countries, but what really makes the difference is an
acceleration in the United States.
These are the figures for 37
countries (of 240 analyzed by Network Wizards) with over
50,000 internet hosts.
| |
Number of hosts
July 1998 |
% change |
% of
total |
Per 1000
inhab. |
| in six months |
in a year |
| United States |
40,970,088 |
+ 34.4 |
+ 72.2 |
72.9 |
155.6 |
| Japan |
2,072,529 |
+ 22.8 |
+ 53.3 |
3.7 |
16.6 |
| United Kingdom |
1,599,524 |
+ 12.3 |
+ 34.3 |
2.9 |
24.4 |
| Germany |
1,426,928 |
+ 8.4 |
+ 23.6 |
2.5 |
17.2 |
| Canada |
1,294,447 |
+ 8.7 |
+ 26.0 |
2.5 |
42.9 |
| Australia |
907,637 |
+ 14.6 |
+ 21.0 |
1.6 |
50.2 |
| France |
653,686 |
+ 33.9 |
+ 51.7 |
1.2 |
11.3 |
| Netherlands |
637,591 |
+ 13.0 |
+ 23.9 |
1.1 |
43.1 |
| Finland |
577,029 |
+ 5.6 |
+ 12.4 |
1.0 |
112.8 |
| Sweden |
515,032 |
+ 19.3 |
+ 35.3 |
0.9 |
58.7 |
| Taiwan |
424,209 |
+ 37.4 |
+ 40.9 |
0.8 |
19.8 |
| Italy |
393,627 |
+ 16.2 |
+ 22.7 |
0.7 |
6.9 |
| Norway |
335,898 |
+ 5.4 |
+ 7.5 |
0.6 |
77.4 |
| Brazil |
310,138 |
+ 44.2 |
+ 89.2 |
0.6 |
2.0 |
| Spain |
302,457 |
+ 14.5 |
+ 24.2 |
0.5 |
7.6 |
| Denmark |
287,273 |
+ 2.7 |
+ 51.0 |
0.5 |
55.5 |
| Belgium |
272,876 |
+ 64.5 |
+ 77.5 |
0.85 |
27.0 |
| Switzerland |
264,426 |
+ 17.9 |
+ 26.7 |
0.85 |
36.7 |
| Korea |
260,146 |
+ 39.6 |
+ 48.8 |
0.5 |
5.8 |
| Mexico |
224,239 |
+ 99.1 |
+ 167.1 |
0.4 |
2.4 |
| Austria |
203,774 |
+ 66.1 |
+ 54.1 |
0.3 |
26.6 |
| Russia |
191,397 |
+ 14.7 |
+ 24.5 |
0.3 |
1.3 |
| New Zealand |
182.021 |
+ 32.6 |
+ 2.2 |
0.3 |
51.1 |
| Poland |
158,099 |
+ 45.6 |
+ 60.0 |
0.3 |
4.1 |
| South Africa |
140,470 |
– 2.8 |
= |
0.3 |
3.4 |
| Israel |
114,192 |
+ 16.8 |
+ 30.3 |
0.2 |
20.3 |
| Singapore |
103,862 |
+ 54.9 |
+ 74.7 |
0.2 |
36.4 |
| Argentina |
101,833 |
+ 53.2 |
+ 77.0 |
0.2 |
2.9 |
| Hong Kong |
98,183 |
+ 18.6 |
+ 35.9 |
0.2 |
16.6 |
| Hunghary |
93,759 |
+ 12.3 |
+ 26.7 |
0.2 |
9.3 |
| Czech Republic |
87,976 |
+ 19.3 |
+ 34.0 |
0.2 |
8.6 |
| China (excl, HK) |
62,935 |
+ 264.7 |
+ 225.9 |
0.1 |
0.05 |
| Greece |
62,760 |
+ 21.8 |
+ 56.7 |
0.1 |
6.0 |
| Portugal |
59,338 |
+ 19.3 |
+ 29.3 |
0.1 |
6.0 |
| Ireland |
58,399 |
+ 6.4 |
+ 30.2 |
0.1 |
16.6 |
| Malaysia |
53,447 |
+ 11.7 |
+ 31.1 |
0.1 |
3.0 |
| Turkey |
51,295 |
+ 57.9 |
+ 84.1 |
0.1 |
0.8 |
| Total |
56,218,330 |
+ 30.0 |
+ 53.0 |
|
2.8 * |
| * "Gobal" density is calculated excluding the United States. |
US domination is increasing. As usual, there are
differences between these figures and those in the European
survey (it's probably a matter of timing as well as
methodology) but the broad pattern is not contradictory.
By geographic areas the picture is basically the same as
we had seen in previous surveys.
Continents
Data by Network Wizards – August 18 1999
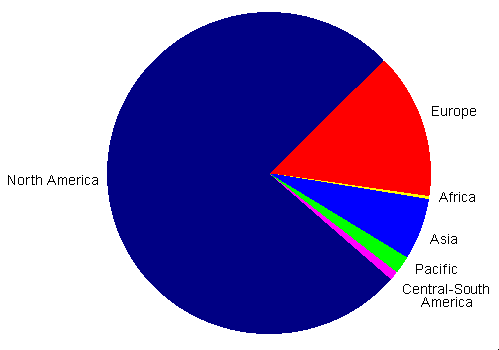
There are changes in some areas (for instance in
South America and parts of Asia) but on a large scale the
situation hasn't changed. There is still high concentration
within each of the areas. 96 percent of the net in North
America is in the US (3 percent on Canada, 0.5 in Mexico). 99
percent of the Pacific is in two countries – Australia and
New Zealand. In Asia Japan still has "the lion's
share", though it's down from 68 to 61 percent. 92
percent of Africa is in South Africa, 77 percent of
Central-South America is in Brazil and Argentina. Only in
Europe no single country has more than 20 percent; but 60
percent of the European net is in six countries.
The ever-increasing US domination is obvious in the next
graph.
10 countries
Countries with over 400,000 internet hosts – Data by Network Wizards – August 28 1999
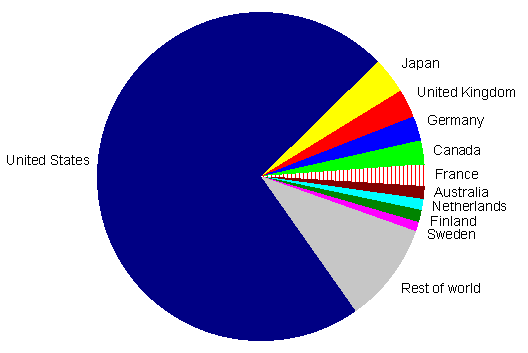
Note: in this graph, as in those following, the "slice" for France
is increased by a rough estimate of the minitel peculiarity.
For better readability of the graph, here is a picture of
the 16 countries with over 300,000 internet hosts – not
including the United States.
16 countries
Countries with over 300.000 internet hosts (United States excluded)
Data by Network Wizards – August 18 1999
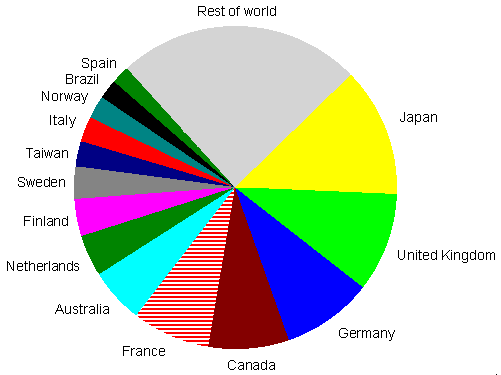
At a glance, this may seem the same as in the past; but
there are changes. For instance Brazil has overtaken Spain
and is in this group for the firsts time; France is getting
stronger even if we don't consider the minitel. Let's compare
this with a "pie" based on the latest European
data.
13 European countries
Countries in Europe with over 200.000 internet hosts
Data by RIPE – August 6 1999
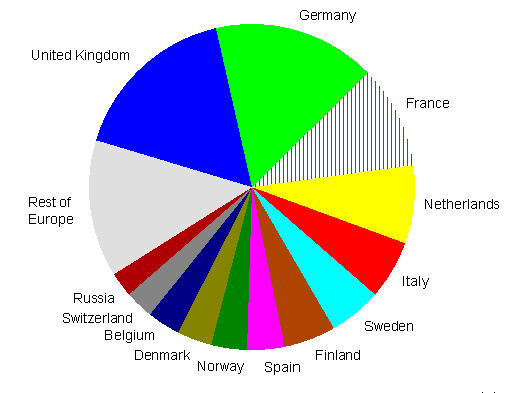
Italy is looking a bit better here than it
appears, so far, in the worldwide survey. But if we are to
consider "the strongest economies worldwide", here
is the situation in the "G8".
G8 countries
Data by Network Wizards – August 18 1999
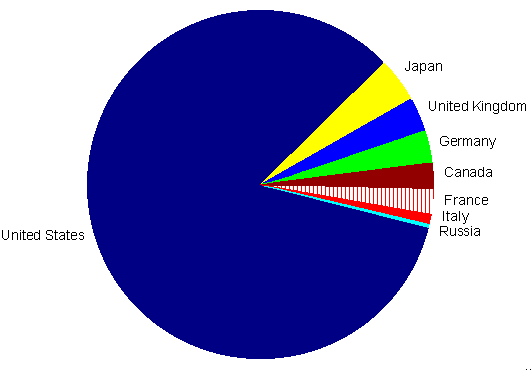
The picture is pretty obvious. The next graph is even more
relevant: an update on density.
Internet hosts
per 1000 inhabitants in 28 countries
Countries with over 100,000 internet hosts – Analysis on data by Network Wizards
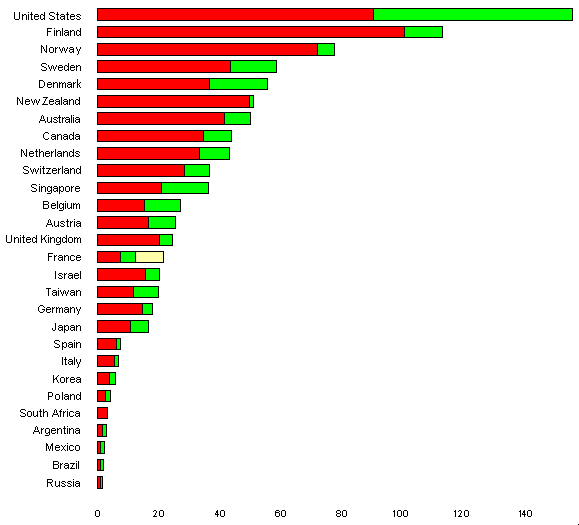
The green slice of bars is growth in a year, from July 1998 to July 1999.
The yellow slice in the bar for France is an approximate estimate of the minitelfsctor.
United States leadership is confirmed also in per-capita density. Finland is no longer the world leader,
though Scandinavia remains the most active group of countries online. In Asia, Singapore and Taiwan are
getting stronger.
Now let's look at the index in relation to income (GNP).
Internet hosts in relation to income (GNP) in 28 countries
Countries with over 100,000 internet hosts – Analysis on data by Network Wizards
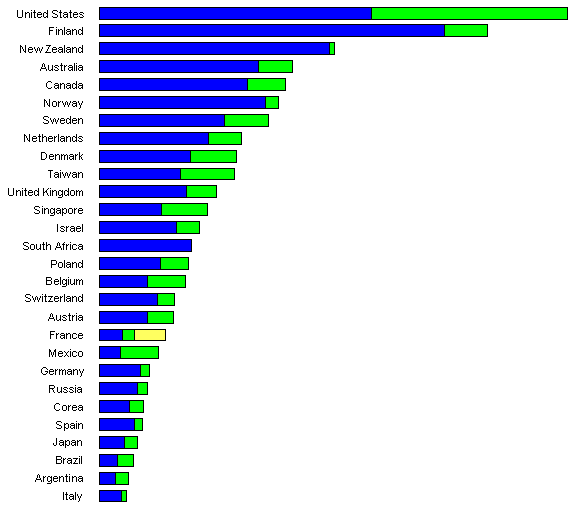
As in the previous graph, the green slice of bars is growth in a year, from July 1998 to July 1999.
The yellow slice in the bar for France is an approximate estimate of the minitel factor.
The news here is US domination even in relation to
income. Once again we see Japan and Germany rather weak in
proportion to their economies. The picture is quite bleak as
seen from Italy – though the latest European survey shows some
improvement, bringing Italy close to the (not so wonderful)
position of France if we don't consider the minitel.
==========================================
Let's look at an update of the world map by internet
density.
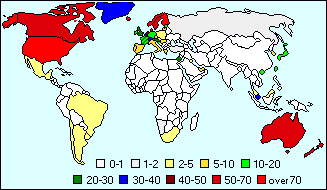
There are some changes – for instance in Latin
America – but we continue to see high concentration in a few
parts of the world and very large "empty" areas.
The road to "globality" is still long and
uphill.
back to top