|
Here's an update on the EITO 99 (European Information Technology Observatory 99) report. We had seen last year's data in issue 18. Of course statistics are always debatable; and especially figures about online "users" are quite uncertain. But I think it's useful to look at another source.
The 430-page Eito report is crammed with figures. I am summarizing here only those concerning general market trends.
According to Eito, this is the size of the combined IT and telecommunications market by large geographic areas (millions of Ecu).
(Eito uses the Ecu conventional currency, which is the same as the Euro but with a difference: in eleven countries the Euro now is an actual currency and exchanges with the "old" currencies are fixed - but not in the rest of Europe. The value of the Euro - or Ecu - fluctuates; currently it's a few cents more than a US dollar).
| |
1997 |
1998 |
% change
over 1995 |
% of total |
Per capita * |
| United States |
476.758 |
517.537 |
+ 30 |
36,8 |
1.934 |
| Europe |
405.300 |
436.952 |
+ 29 |
30,2 |
621 |
| Japan |
170.020 |
164.284 |
+ 9 |
11,4 |
1.303 |
| Rest of world |
291.590 |
326.110 |
+ 43 |
22,6 |
70 |
| World total |
1.343.667 |
1.444.910 |
+ 30 |
|
250 |
| * Ecu per inhabitant - 1998 |
Analysis on Eito 99 data |
|
The "rest of the world" is growing faster than the United States and Europe, but differences remain enormous. Of course some European countries have much higher per-capita investment than the European average.
This is the development of the information technology market in sixteen European countries (US added for comparison):
| IT mark (millions of Ecu) |
| |
1996 |
1997 |
1998 |
% 98
over 97 |
% of
W. Europe |
Per capita |
| Switzerland |
6.818 |
7.276 |
7.743 |
+ 6,5 |
3,8 |
1.080 |
| Sweden |
6.517 |
6.990 |
7.743 |
+ 10,2 |
4 |
876 |
| Denmark |
3.857 |
4.211 |
4.556 |
+ 8,2 |
2 |
857 |
| Norway |
3.126 |
3.473 |
3.742 |
+ 8,9 |
1,9 |
852 |
| United Kingdom |
33.536 |
34.820 |
40.442 |
+ 9,8 |
20 |
686 |
| Netherlands |
8.254 |
9.113 |
9.333 |
+ 9 |
4,8 |
599 |
| Francia |
28.729 |
31.118 |
34.176 |
+ 9,8 |
17,7 |
583 |
| Finland |
2.427 |
2.688 |
2.946 |
+ 9,6 |
1,5 |
573 |
| Germany |
38.105 |
40.993 |
44.874 |
+ 9,5 |
23,3 |
547 |
| Belgium/Lux. |
4.540 |
5.032 |
5.541 |
+ 10,1 |
2,9 |
522 |
| Austria |
3.443 |
3.773 |
4.106 |
+ 8,8 |
2,1 |
508 |
| Ireland |
1.081 |
1.189 |
1.312 |
+ 10,3 |
0.07 |
360 |
| Italy |
14.193 |
15.093 |
16.340 |
+ 8,3 |
8,5 |
284 |
| Spain |
6.000 |
6.630 |
7.703 |
+ 9,5 |
4 |
196 |
| Portugal |
1.131 |
1.263 |
1.383 |
+ 9,5 |
0,7 |
139 |
| Greece |
794 |
889 |
992 |
+ 11,9 |
0,5 |
94 |
| Western Europe |
162.553 |
176.506 |
193.044 |
+ 9,4 |
|
428 |
| Total Europe |
174.908 |
190.864 |
206.647 |
+ 8,3 |
|
294 |
| United States |
262.421 |
291.313 |
319.297 |
+ 9,6 |
|
1.193 |
| Analysis on Eito 99 data |
The United Kingdom leads over the other "big" European countries, with per-capita investment 18 percent larger than France and 25 percent larger than Germany.
This is Eito's report on the telecommunications market in the same countries.
| Telecomunications market (millions of Ecu) |
| |
1996 |
1997 |
1998 |
% 98 over 97 |
% W. Europe |
Per capita |
| Switzerland |
5.977 |
6.426 |
6.895 |
+ 7,5 |
3,5 |
962 |
| Norway |
2.482 |
3.016 |
3.235 |
+ 7,3 |
1,6 |
737 |
| Sweden |
5.219 |
5.559 |
5.949 |
+ 7,0 |
3 |
672 |
| Ireland |
1.948 |
2.169 |
2.431 |
+ 12,1 |
1,2 |
667 |
| Netherlands |
7.956 |
8.799 |
9.662 |
+ 9,4 |
5 |
621 |
| Denmark |
3.154 |
3.411 |
3.065 |
+ 5,7 |
1,5 |
576 |
| United Kingdom |
29.472 |
31.441 |
33.139 |
+ 5,4 |
16,7 |
562 |
| Finland |
2.421 |
2.612 |
2.862 |
+ 9,6 |
1,4 |
556 |
| Germany |
39.677 |
41.874 |
44.166 |
+ 5,5 |
22,2 |
539 |
| Belgium/Lux. |
4.712 |
5.173 |
5.654 |
+ 9,3 |
2,8 |
532 |
| France |
25.245 |
27.478 |
30.206 |
+ 9,9 |
15,2 |
515 |
| Austria |
3.372 |
3.731 |
4.061 |
+ 8,9 |
0.00 |
502 |
| Italy |
21.958 |
24.171 |
27.698 |
+ 14,6 |
13,9 |
482 |
| Greece |
2.806 |
3.263 |
3.835 |
+ 16,3 |
1,8 |
354 |
| Portugal |
2.602 |
29.851 |
3.308 |
+ 10,8 |
1.07 |
333 |
| Spain |
10.522 |
11.322 |
12.417 |
+ 9,7 |
6,2 |
315 |
| Western Europe |
169.887 |
183.430 |
199.086 |
+ 8,0 |
|
441 |
| Total Europe |
174.908 |
190.874 |
206.647 |
+ 8,3 |
|
294 |
| United States |
262.241 |
291.313 |
319.279 |
+ 9,6 |
|
1.193 |
| Analysis on Eito 99 data |
The two markets have similar development in the more advanced countries, while in Southern Europe IT is smaller than telecommunications. The growth in telecommunications is driven by the expansion of mobile phones.
Here is a comparison of the number of phone lines in seven countries.
Telephone lines
(numbers in thousands)
|
| |
1997 |
1998 |
% change |
% of
world total |
Per 100
inhabitants |
| United States |
175.996 |
182.616 |
+ 3,8 |
21,4 |
68,2 |
| France |
33.733 |
34.272 |
+ 1,6 |
4,0 |
58,5 |
| Germany |
45.334 |
46.448 |
+ 2,5 |
5,5 |
56,6 |
| UK |
31.597 |
32.585 |
+ 3,2 |
3,8 |
55,3 |
| Japan |
63.300 |
64.566 |
+ 2,0 |
7,6 |
51,2 |
| Italy |
25.612 |
26.548 |
+ 3,7 |
3,1 |
46,2 |
| Spain |
15.854 |
16.391 |
+ 3,4 |
1,9 |
41,7 |
| Europe |
287.530 |
299.305 |
+ 4,1 |
35,11 |
42,6 |
| World |
797.083 |
852.411 |
+ 6,9 |
|
14,7 |
|
Analysis on Eito 99 data |
The picture, of course, is quite different in the case of mobile phones.
Mobile phones
(numbers in thousands)
|
| |
1997 |
1998 |
% change |
% of
world |
Per 100
inhabitants |
| Italy |
11.730 |
20.000 |
+ 70,5 |
6,6 |
34,8 |
| Japan |
28.746 |
40.000 |
+ 39,2 |
13,1 |
31,9 |
| United States |
44.093 |
55.000 |
+ 24,7 |
18,1 |
20,1 |
| United Kingdom |
8.344 |
11.300 |
+ 35,4 |
3,7 |
19,2 |
| France |
5.729 |
10.500 |
+ 83,3 |
3,5 |
17,9 |
| Germany |
8.252 |
13.800 |
+ 67,2 |
4,5 |
16,8 |
| Spain |
4.337 |
6.300 |
+ 45,3 |
2,1 |
16,0 |
| Europe |
60.597 |
97.913 |
+ 61,6 |
30,4 |
13,9 |
| World |
205.901 |
304.380 |
+ 47,8 |
|
5,3 |
|
Analysis on Eito 99 data |
These data confirm the widespread notion of Italy's mobilemania. It's now the biggest market for mobile phones in Europe, with per-capita density higher than the United States and Japan.
Now let's look at online connections. Of course it's always difficult to understand how "users" are counted. Even Eito appears to have changed its criteria since last year's report. But let's assume that, at least, they are using the same counting system for all countries...
"For what it's worth", this is what the report says. Let's start with the same seven countries as in other charts.
Online service users
(numbers in thousands)
|
| |
1997 |
1998 |
% change |
% of
world |
Per 100
inhabitants |
| United States |
58.395 |
72.547 |
+ 24,4 |
48,9 |
27,3 |
| United Kingdom |
6.198 |
8.110 |
+ 30,9 |
5,5 |
13,8 |
| France |
7.038 |
7.541 |
+ 7,1 |
5,1 |
12,8 |
| Germany |
5.529 |
7.297 |
+ 32,1 |
4,9 |
8,9 |
| Japan |
7.377 |
9.827 |
+ 33,2 |
6,6 |
7,8 |
| Spain |
853 |
1.106 |
+ 29,7 |
0,8 |
2,8 |
| Italy |
680 |
1.108 |
+ 62,9 |
0,8 |
1,9 |
| Europe |
48.905 |
62.215 |
+ 27,1 |
42,0 |
8,9 |
| World |
113.301 |
148.222 |
+ 30,8 |
|
2,6 |
|
Analysis on Eito 99 data |
As in previous Eito reports, France has much higher online activity than appears from other indicators. This is due to the French peculiarity that we have already discussed in other issues: the minitel.
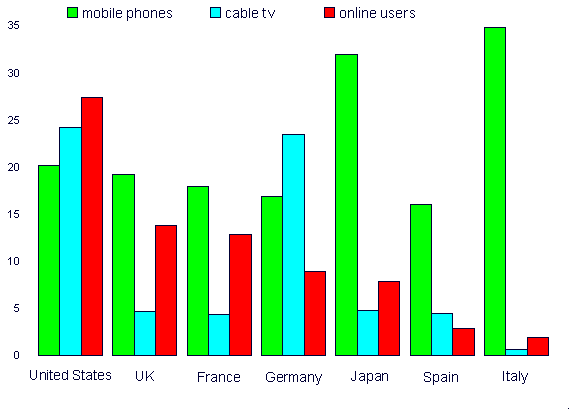
Let's look at a graph that compares the use of three communication systems in seven countries.
Three communication systems
(users per 100 inhabitants - 1998) |
 |
| Analysis on Eito 99 data |
In the United States several communication technologies are almost equally developed - with the internet leading over mobile phones and even long-established cable tv. Not so in the rest of the world, where the differences are quite remarkable.
Now let's look in some detail at the situation in Europe. The chart is rather complicated, but it tells an interesting story.
Four communication systems in 22 European countries
numbers in thousands - 1997 |
| |
Telephone
lines |
Teleph.
% inhab. |
Cable
TV |
Cable
% fam. |
Mobile
phones |
Mobile
% inhab. |
Online |
Online
% inhab. |
| Sweden |
6.100 |
68,5 |
1.935 |
47,5 |
3.187 |
35,8 |
1.230 |
13,8 |
| Norway |
2.680 |
60,9 |
729 |
35,8 |
1.685 |
38,3 |
522 |
12,1 |
| France |
33.733 |
57,7 |
2.299 |
9,8 |
5.792 |
9,9 |
7,038 |
12,0 |
| United Kingdom |
31.597 |
53,6 |
2.403 |
9,8 |
8.344 |
14,2 |
6.198 |
10,5 |
| Finland |
2.860 |
55,8 |
832 |
39,1 |
2.148 |
41,9 |
521 |
10,2 |
| Denmark |
3.320 |
62,9 |
1.040 |
43,3 |
1.489 |
28,2 |
540 |
10,2 |
| Switzerland |
4.700 |
66,2 |
2.390 |
79,5 |
1.044 |
14,7 |
606 |
8,5 |
| Luxembourg |
280 |
67,7 |
134 |
92,2 |
67 |
16,2 |
31 |
7,4 |
| Germany |
45.334 |
55,2 |
18.500 |
49,5 |
8.252 |
10,0 |
5.529 |
6,7 |
| Austria |
4.013 |
49,6 |
1.080 |
34,9 |
1.164 |
14,4 |
480 |
5,9 |
| Netherlands |
8.864 |
56,5 |
5.787 |
89,2 |
1.690 |
10,8 |
826 |
5,3 |
| Ireland |
1.460 |
40,6 |
585 |
49,1 |
510 |
14,2 |
157 |
4,4 |
| Belgium |
4.769 |
46,8 |
3.650 |
88,6 |
983 |
9,0 |
403 |
4,0 |
| Spain |
15.854 |
40,4 |
1.641 |
13,5 |
4.337 |
11.0 |
853 |
2,2 |
| Portugal |
4.002 |
40,4 |
371 |
11,3 |
1.507 |
15,2 |
216 |
2,2 |
| Poland |
7.300 |
18,9 |
3.000 |
23,6 |
832 |
2,2 |
687 |
1,8 |
| Czech Republic |
3.277 |
31,8 |
880 |
21,8 |
524 |
5,1 |
164 |
1,6 |
| Hungary |
3.100 |
30,5 |
1.240 |
31,1 |
703 |
6,9 |
147 |
1,4 |
| Italy |
25.612 |
44,6 |
52 |
0,3 |
11.730 |
20,4 |
680 |
1,2 |
| Greece |
5.430 |
51,7 |
3 |
0,1 |
975 |
9,3 |
110 |
1,0 |
| Romania |
3.616 |
16,0 |
2.580 |
34,5 |
209 |
0,9 |
25 |
0,1 |
| Bulgaria |
2.690 |
32,0 |
200 |
6,8 |
53 |
0,6 |
9 |
0,1 |
| Western Europe |
217.386 |
48,1 |
43.940 |
26,1 |
56.879 |
12,6 |
26.539 |
5,9 |
| Source: Eito 99 |
The highest density of mobile phones is not in Italy, as some people think, but is Scandinavia; where, as we know, there is also heavy use of the internet. It's no news that cable is strong in the Benelux area. I think this report underestimates online activities in Finland, the Netherlands and Belgium. We have already discussed the impact of the mintel factor in France.
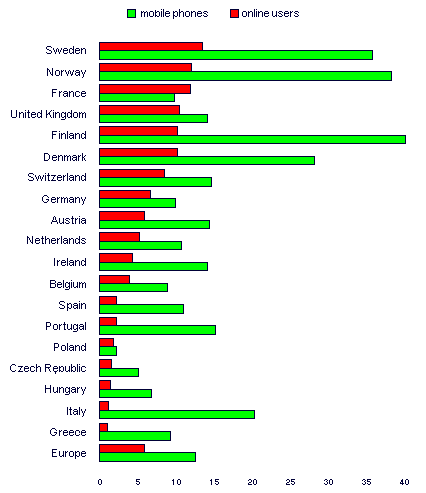
For a simplified visual perception of differences, here is a chart that considers only two communication systems: mobile phones and online.
Online connections and mobile phones
online "users" and mobile telephones per 100 inhabitants - 1997 |
 |
Note: "Europe" here stands for Western Europe plus Turkey.
Source: Eito 99 |
In all of Europe (including France, according to more recent data) mobile phones are much more widely spread than online connections . A short-term reversal of this trend seems unlikely.
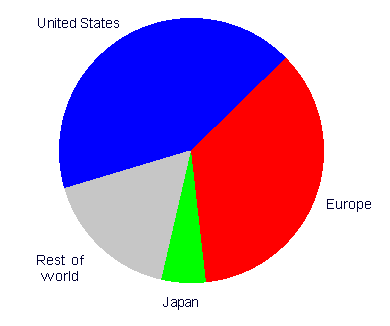
This is the "global" picture of online connections according to Eito. I think it tends to overestimate Europe.
This is the online situation in Europe - as seen by Eito.
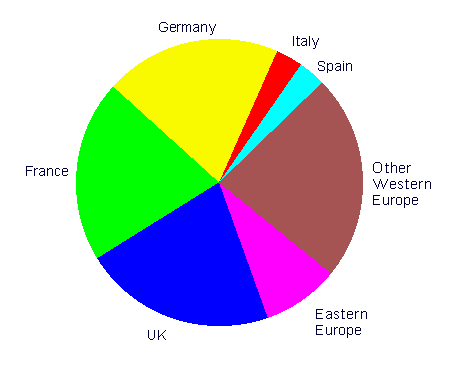
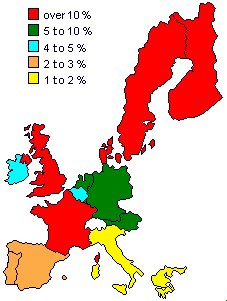
According to this source, 68 percent of all online users in Europe are in three countries (United Kingdom 24 %, France 22 % and e Germany 21 %) that have 28 percent of Europe's population.
If we draw a map of the European Union according to these data, it looks somewhat different from other maps that we had seen.
| Online users as % of inhabitants in the European Union |
 |
| Analysis on Eito 99 data |
As I've already said... I'm not comfortable with Eito data for some of the countries. But, while some details don't don't fit with what we learn from other sources, the broad picture is generally the same. The development of online activity is patchy, in Europe as well as worldwide.
back to top
|


